Download
1 / 24
240 likes | 359 Vues
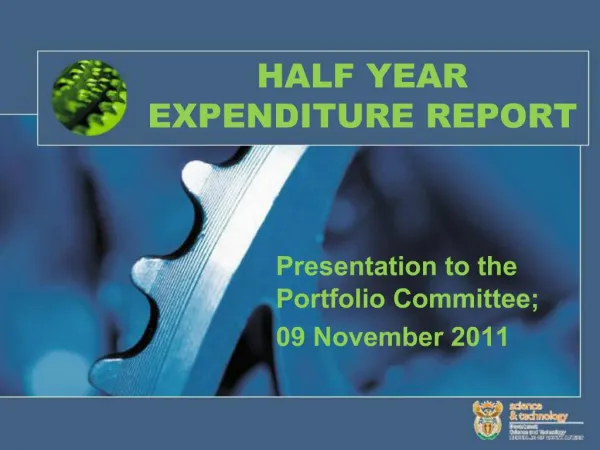
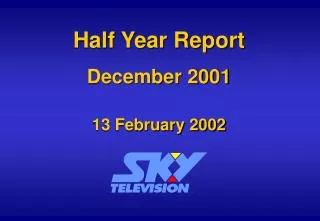
Half Year Report December 2002 19 February 2003. Subscriber Count. Total Revenue. CAGR 16%. $345. Pay Television Penetration. Australia 22% France 32% New Zealand 37% United Kingdom 41% Finland 45% Germany 70% Switzerland 83% United States 85%

E N D
Total Revenue CAGR 16% $345
Pay Television Penetration • Australia 22% • France 32% • New Zealand 37% • United Kingdom 41% • Finland 45% • Germany 70% • Switzerland 83% • United States 85% • BeNeLux 95%
SkyBet SKY Bet
Advertising Revenue CAGR 22% $16.5
2000 2002 2001 Tri Nations Rugby Live Tri Nations Rugby Live Inter Rugby Live Tri Nations Live Inter Rugby Live Super 12 Final Live Inter Rugby Live Super 12 Rugby Live Super 12 Rugby Live Inter Rugby Live Tri Nations Rugby Live Tri Nations Rugby Live NPC Rugby Live Bledisloe Cup Live Super 12 Live NPC Rugby Live International Rubgy Live NPC Rugby Live Tri Nations Live NPC Rugby Live Tri Nations Rugby Live NRL Pre Final NRL Final Live Live Tri Nations Live Tri Nations Live Inter Rugby Live Inter Rugby Live NPC Final Live Super 12 Final Live Inter Rugby Live The Effect of Rugby SKY’s Top Ten Rating Programmes in SKY Homes (%) Source: AC Neilson McNair
Monthly Closes NZ$/US$ (Dec'84-Dec'02) Source: Reuters
EBITDA CAGR 16% $108.2
Net Profit/(Loss) -$30.2
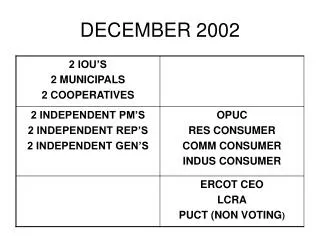
‘000 2001 2002 % Change UHF Residential 138.6 121.6 (12%) DBS Residential 267.1 310.3 16% DBS Wholesale 30.4 77.2 154% Commercial 6.7 7.6 13% Total Subscribers 442.8 516.7 17% Subscriber Growth
$ million 2001 2002 % Change Programming 80.9 78.9 (2.5%) Subscriber Management 6.2 6.1 (0.2%) Transmission 3.4 3.5 1.7% Selling, General & Administration 24.2 23.9 (1.3%) Depreciation & Amortisation 54.4 60.9 12% Total Operating Expenses 169.1 173.3 2.5% Expense Analysis
$ million 2001 2002 % Change Net Operating Cash Flow 42.5 70.7 66.4% Net Investing Cash Flows (59.6) (59.5) (0.2%) Free Cash Flow (17.1) 11.2 166% Free Cash Flow
Foreign Currency Hedging 49% hedged for 0-12 months $US exposures @ .4354 21% hedged for 12-24 months $US exposures @ .4303 97% hedged for 0-12 months $A exposures @.8506 0% hedged for 12-24 months $A exposures average payment rate for 6 mths to Dec 02 - 44.5c