Download
1 / 44
450 likes | 519 Vues
Three Lecures on Understanding Electricity Markets: Introduction. Derek W. Bunn London Business School.

E N D
Three Lecures on Understanding Electricity Markets: Introduction Derek W. Bunn London Business School
Derek W. Bunn is currently Professor and Chairman of the Decision Sciences subject area and Director of the Energy Markets Group at the London Business School. Having read Natural Sciences at Trinity College, Cambridge, he received at PhD in Economics from London Business School (1975), and was subsequently elected CEGB Fellow in Engineering Economics at Worcester College, Oxford University. Occasionally since then, he has been a visiting professor at Stanford University in California. Author of over 180 research papers and 10 books in the areas of forecasting, decision analysis and energy economics, the latest of which are Systems Modelling for Energy Policy (Wiley, 1997), Strategic Price Risk in Wholesale Electricity Markets (Risk Publications, 1999) and Modelling Prices in Competitive Markets for Electricity (Wiley, 2004). He is Editor in Chief of the Journal of Forecasting, Honorary Editor of Energy Economics, as well as having served on the editorial boards of 12 other academic journals. As a prominent international advisor on energy economics, he has consulted for many global energy companies and advised a number of government agencies. • London Business School, Sussex Place, Regents Park, London NW1 4SA, ENGLAND • Tel: [44] (0) 20 7706 6874, Fax: [44] (0) 20 7724 7875, • Email: dbunn@london.edu
Overview: Three Lectures • Understanding Liberalised Electricity Markets • How the Competitive Markets Work • Transmission, Trading and Retail Issues • Institutional Change and Regulatory Policies • Modelling Strategic Market Evolution • Strategic Behaviour and Gaming • Agent Based Simulation Methods • 3. Econometric Modelling of Price Formation • Fundamental and Dynamic Analysis of Prices • Volatility and Risk Premia • Transmission Capacity Auctions
Today’s Agenda: • Electricity and Energy Market Drivers of Change Global Issues in Power and Gas Fundamentals of Power System Economics • Wholesale Market Mechanisms: Price Setting and Price Manipulation • Competitive Market Evolution • Strategic Opportunism and Regulatory Restraint Tomorrow will then mainly be on modelling…..
The Global Context……. 27% of the World Population have No Electricity In SE Asia it is 60% In Sub Sahara Africa it is 78% 80% of those without power are Rural, and many live on Small Islands…. Electrification is a social and economic need, but how and who will provide? These will require quite different solutions from the network systems we see in developed countries
The Investment Challenge…… • IEA projects current trends lead to a 60% increase in world energy demand by 2030…. • 85% of this will be fossil fuel (coal, oil, gas) • 66% will be in the developing world • Over half of the oil will still be from OPEC • “No power costs more than no power” (Indira Ghandi) • Economic growth in many developing countries has been restrained by power shortages • World Electricity Investment needs to be $16 trillion and in OECD alone, $4 trillion • For growth, replacement, and infrastructure • But Governments now expect the Market to Provide….
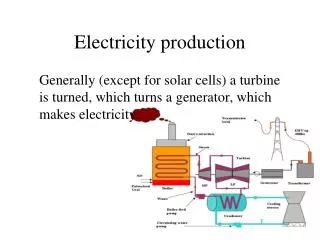
Electricity is produced as a commodity….. and consumed as a service…… Generators Consumers Physical Electricity Flow Distribution Transmission
Unbundling and the Introduction of Markets Generators Consumers Suppliers WHOLESALE MARKET RETAIL MARKET Contract Flow Physical Electricity Flow Distribution Transmission
The Standard Electricity Liberalisation …. • Wholesale Competition introduced between generators to lower the commodity price • Wholesale Markets (Pools or Exchanges) facilitate trading • Retail Competition introduced between retail distributors to lower the cost of service. • Network Monopolies, Transmission and Distribution, remain Regulated. • Full Unbundling of the Ownership of Generation, Transmission, Distribution and Retail usually advocated for efficient new entry and exit. (But Vertical Integration is becoming widely tolerated )
Electricity Liberalisation became a world trend … • Why? • Belief in markets to deliver more efficient investment and productivity gains. This should lead to lower prices (?) • Ideologies: Popular Capitalism, Privatisation, Single Markets • Leaders and Followers… • Early 1990s: Chile, NZ, UK, Norway • Mid/Late 1990s: California, NE US, Australia, Nordic, Spain, Germany • 2000s: Italy, France & the rest of the EU, • And then there were the crises: California, Enron, British Energy and Blackouts …..
But Energy Policy is delicate and contradictory…. • The Electricity Sector is being shaped by inherent conflicts…. • Institutional Drivers • Economic Ideologies of Liberalisation • Industrial Competitiveness • Concerns about security of supply • Responsibilities for public service • Worries on Global Warming • Fundamental Drivers • Demand and Supply • Geopolitics of Fuels • Strategic Drivers • Shareholder Value: Growth and Returns • Market Structure and Market Power
Fundamentals First……………. • Before competitive markets arrived, the major uncertainties were • Demand Growth • Technology Choice • Fuel Costs • These are still fundamental, especially the primary fuel markets: coal, oil and gas • And this is the way Commercial forecasting products still work.
Analysts used to think demand increased exponentially, simply with GDP and Population…… German Energy Forecasts But we are now aware of declining energy intensities…
Total Energy Consumption per $GDP 16,000 14,000 12,000 10,000 United States United Kingdom 8,000 Germany France 6,000 4,000 2,000 0 1980 1981 1982 1983 1984 1985 1986 1987 1988 1989 1990 1991 1992 1993 1994 1995 1996 1997 1998 1999 2000 2001 2002 2003
Total Energy Consumption per $GDP 120,000 100,000 80,000 60,000 40,000 20,000 0 1980 1981 1982 1983 1984 1985 1986 1987 1988 1989 1990 1991 United States United Kingdom Germany France China India 1992 1993 1994 1995 1996 1997 1998 1999 2000 2001 2002 2003
Oil is still the Basic Commodity Transport is crucial, but still widely used for Power Generation Gas Prices are often linked Continental European Gas Prices tend to lag 3-6 months to a moving average of 6-9 months Oil Prices Always been difficult to forecast Oil Prices….
In 1982, when considering new power investment in the UK…. Observe the implicit Random Walk thinking…
By the 1990s, analysts thought oil was “mean-reverting” 10 year High, Reference and Low Oil Price Scenarios (US Dept of Energy) Jan 2005 Forecast2Forecast004 H R L
Global Gas Demand overtakes Oil ~ 2020 to 2030 160 140 120 100 Million Barrels Oil Equivalent / Day 80 60 40 20 0 2030 1980 1990 2000 2010 2020 Gas has now become a major focus of interest…. Gas Demand Oil Demand CAGR: 3.5% (2005 – 2015) CAGR:2.2% (2005 – 2015)
TCF Gas – Proved Reserves 1800 1600 1400 1200 1000 800 600 400 200 0 Iraq Iran USA UAE Qatar Algeria Nigeria Norway Trinidad Australia Malaysia Indonesia Venezuela Netherlands Saudi Arabia Turkmenistan Russian Fed. Where are the Gas Reserves?
Liquefaction costs trend continues $ per tonne of capacity
Global LNG Supply Sources 90 Guinea 80 Angola Snøhvit 70 Libya UAE 60 Yemen Venezuela Oman 50 Brunei bcfd Bolivia 40 Egypt Malaysia 30 Trinidad Australia 20 Indonesia Nigeria Algeria 10 Iran Qatar 0 2005 2010 2015 2020
Electricity Fundamentals Continued…. • Before competitive markets arrived, the major uncertainties were • Demand Growth • Fuel Costs • Technology Choice • And Investments reflected an Economic and Political mixture of • High capital cost/low operating cost plant for baseload (eg nuclear) • Low capital cost/high operating cost plant for peaks (eg gas)
Demand Drivers are Fundamental: • In the longer term, we have • economic activity, population growth • technological change and conservation • In the shorter term, we have • weather (temperature, cloud cover, wind) • daily and seasonal patterns of consumption • unusual business and social events
GW Typical Winter Peak Typical Winter Day Typical Summer Day Minimum Summer Day Typical Summer and Winter Demands
+ 400 (1%) + 700 (2%) + 1500 (4%) + 800 (2%) Weather Effects on Winter Demand Meteorological Variable Response (MW) Generating Unit* Temperature (a fall of 1 Celsius in freezing conditions) Wind (an increase of 10 knots in freezing conditions) Cloud cover (from clear sky to thick cloud) Precipitation (from no rain to heavy rain) * Based on 500MW Source NGT
Effects of popular weekly TV shows, eg “EastEnders”
Unusual TV events are harder to predict…… 31000 Full-Time 600 MW Audience: 12 - 14 million 30500 30000 Demand Half-Time 900 MW 29500 England V Germany 29000 Previous Saturday 28500 19:00 19:05 19:10 19:15 19:20 19:25 19:30 19:35 19:40 19:45 19:50 19:55 20:00 20:05 20:10 20:15 20:20 20:25 20:30 20:35 20:40 20:45 20:50 20:55 21:00 Time
So what does this mean for the mix of generating plant? • Some plant has to respond quickly to demand and may not run for very long • What kind of start-up and running costs do we need • for this purpose? • This is known as “peaking plant” • In contrast to plant which is the cheapest to run continuously throughout the day and night • Which is known as “baseload plant”
German Technology Mix • Gas is mainly peaking • In the UK, it is mainly baseload
The Economic Mix of Technologies • The system consists of Peaking and Base Load Plant which differ in terms of: • Basic Economics: • Base load is low variable cost • Peaking is low investment and fixed cost • Technical Capabilities • Peaking Plant will have to be more flexible • with faster start-ups, and lower start-up costs. • The Cost of Power from Each Technology • Depends upon Both Fixed and Variable Costs • And also…?
Apart from the fundamental demand cycles,In competitive markets, the utilisation depends upon competition in the wholesale market.In the wholesale market, the “Stack” of plant is the basic concept for price formation…. Utilisation…………
Prices in Wholesale Markets (Power Pools) are often set as followsFor Each Trading Period (eg Hour), Demand is Forecast or Bid into the market, Plant are Stacked According to Offer Prices ie marginal cost plus Mark-UpMarket Price is the Price of the most Expensive Genset Required to meet the Forecast Price Demand
Why are Wholesale Power Prices simply not Proportional to fuel prices? Price £/MWh 1999 2002 Figure 1.1 British daily average power and gas prices ( 50% gas-power efficiency assumed) SOURCE: Heren Power Gas
Hydro Intensive Systems have Prices which Depend Upon the Weather…
But the Story of Prices in the UK was Market Power and Regulatory Risk Time Weighted Average Monthly Pool Prices £24 Average Price Cap
Focus on Wholesale Markets in context…… ENGLAND & WALES ANNUAL ELECTRICITY PRICE HISTORY 1990 - 2003 Source: EIA
Electricity Value Chain • Value chain for supply of a typical household in Germany (2003): 30 % 7% 63% wholesale trade production transport distribution retail 9,7 ct/kWh Additional fees and taxes (42% of total bill): 1,8 ct/kWh 0,8 ct/kWh 2,05 ct/kWh 2,3 ct/kWh subsidies for CHP and renewables concession fee electricity tax VAT 16,7 ct/kWh
EC Breakdown of Expected Electricity Prices in 2004for 50 MWh/year small commercial customer (€/MWh) Regulatory Benchmarking is becoming more Prevalent……….
Key Market Issues in the Electricity Value Chain • The Wholesale Market: How do Pools and Power Exchanges work? How is real-time Energy Balancing achieved and paid for? Efficiency of prices in the short term Investment signals for the longer term • The Transmission System Third Party Access and Use of System Charging Inter Regional Trading System Balancing • The Distribution Network Regulation • The Retail and Energy Supply Business Market Segmentation and Churn Rates