Download
1 / 15
180 likes | 554 Vues
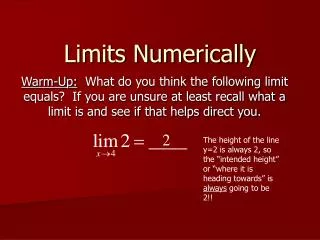
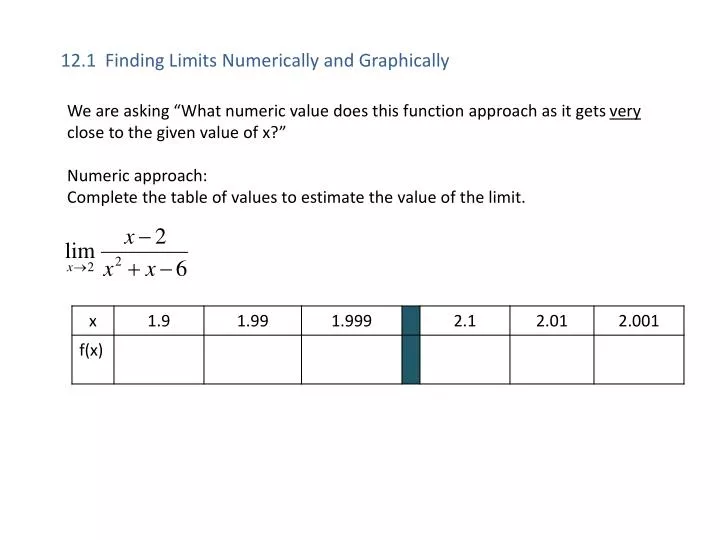
We are asking “What numeric value does this function approach as it gets very close to the given value of x?” Numeric approach: Complete the table of values to estimate the value of the limit. 12.1 Finding Limits Numerically and Graphically.

E N D
We are asking “What numeric value does this function approach as it gets very close to the given value of x?” Numeric approach: Complete the table of values to estimate the value of the limit. 12.1 Finding Limits Numerically and Graphically
We are asking “What numeric value does this function approach as it gets very close to the given value of x?” Graphic approach: Consider the graph and the different types of limits: 12.1 Finding Limits Numerically and Graphically
Find • Find • Find • Find 12.2 Limit Laws
EX. Evaluate the limit, if it exists 12.2 Limit Laws
EX. Evaluate the limit, if it exists First check – does subbing in the value of x take the denominator to 0? EX. Evaluate the limit, if it exists First check – does subbing in the value of x take the denominator to 0? 12.2 Limit Laws
EX. Evaluate the limit, if it exists First check – does subbing in the value of x take the denominator to 0? EX. Evaluate the limit, if it exists First check – does subbing in the value of x take the denominator to 0? 12.2 Limit Laws
Vocabulary: secant line AROC constant function constant slope 2.3 Average Rate of Change (AROC)
Wolfram Demo secant lines 2.3 AROC – given a graph
2.3 AROC – given the function EX. 1 f(z) = 1 – 3z2; find AROC between z = -2 and z = 0 EX. 2 g(x) = ; find AROC between x = 0 and x = h
Wolfram Demo Secant -> Tangent lines 12.3 IROC – Instantaneous Rate of Change Note that in these problems we will use the letter ‘h’ to represent the distance away from the point where we are considering the tangent line (x)
12.3 IROC – algebraic examples EX. 3 f(x) = 1 + 2x – 3x2; find the equation of the tangent line at (1, 0) two different ways. Method 1: consider the limit as x approaches 1 b. Method 2: consider the limit as h approaches 0 Now use the point slope formula to find the line’s equation: slope = -4, goes through (1, 0)
12.3 IROC – algebraic examples Let’s see if this makes sense graphically: f(x) = 1 + 2x – 3x2; We calculated that the equation of the tangent line at (1, 0) is y = -4x + 4
12.3 IROC – classwork practice • f(x) = 1/x2; find the equation of the tangent line at (-1, 1) and graph the function and the tangent line requested. Use method 1 (look at the limit as x approaches -1) • f(x) = ; find the equation of the tangent line at (4, 3) and graph the function and the tangent line requested. Use method 2 (look at the limit as h approaches 0)