Download
1 / 58
580 likes | 678 Vues
State of Finland’s Forests 2012. Based on the Criteria and Indicators of Sustainable Forest Management. Forest cover in Europe, as percentage of land area. Areas in slash-and-burn agriculture in Finland in 1860 and 1913.

E N D
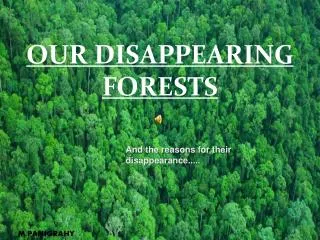
State of Finland’s Forests 2012 Based on the Criteria and Indicators of Sustainable Forest Management
Areas in slash-and-burn agriculture in Finland in 1860 and 1913
The share of strictly protected forests of all forest land (%) in certain European countries (MCPFE class 1.1).
The organisation for the management and development of Finnish forests underlined to the Ministry of Agriculture and Forestry.
Forest area, 1921–2010. Areas ceded to the Soviet Union in 1944. The classification of forest land and low productive forest land in 1921–1953 does not correspond fully with the current classification.
Predominance of tree species on forest land, 1921–2008 Areas ceded to the Soviet Union in 1944
Growing stock volume on forest and low productive forest land, 1921–2010. Areas ceded to the Soviet Union in 1944
Carbon balance between emissions of fossil carbon dioxide and net changes in sequestration of carbon dioxide by forest land (left). Changes of carbon sequestration of forest land by share of wooden biomass, dead organic matter and soil organic matter (right), 1990–2010
Total energy consumption and consumption of wood-based fuels, 1970–2010
Total deposition of sulphatesulphur and nitrogen (nitratenitrogen and ammonium nitrogen) in 2009
Defoliation frequency distribution for pine, spruce and broadleaves in mineral-soil sites, 1986–2008 from 2004 the figures also include reference trees on peatland
Occurrence of damaging agents reducing stand quality in timber production, 2008
Moose winter population and area of damages caused by moose, 1964–2009
Annual increment of growing stock (1935–2010) and annual drain (1950–2010)
Visits to national parks, hiking areas and nature centres, 2000–2010
The share of forest land area by forest ownershipcategory, 2010
Value added in the forest sector and its share in gross domestic product (GDP), 1975–2010
Annual changes in the total GDP and forestsector’s contribution to change, 1976–2010
The share of forest sector in the total regional GDP by forestry centre, 2008
Operating profit per ha of forest land in privateforests, 1991–2010
Production and domestic consumption of paperand paperboard, 1980–2010
Total real value of exports and exports of forest industry products, 1970–2010
Foreign trade in roundwood and forest industry products by product group, 2010
Proportion of forest sector (inlc. furniture industry) of employed persons by forestry centre, 2010
Growing stock volume per hectare (left) and volume (right) on forest, 2010
Carbon stock on forest biomass (above ground and below ground) in million metric tones
Net annual increment of growing stock and annual fellings in Europe (1950–2010)
Annual increment of growing stock (1935–2010) and annual drain in Finland (1950–2010)
Total energy production from wood as percent of the total national primary energy consumption
Total energy consumption and consumption of wood-based fuels, 1970–2010