Download
1 / 22
220 likes | 397 Vues
VEGETATION DATA. Viviana Maggioni Dr. Jeffrey Walker. The Vegetation Sampling. Regional Sampling 16 vegetation biomass samples at the 8 HI-RES areas (week 1 & 3) 6 vegetation biomass samples per farm every Monday at the same location

E N D
VEGETATION DATA Viviana Maggioni Dr. Jeffrey Walker
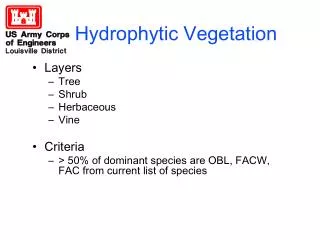
The Vegetation Sampling • Regional Sampling • 16 vegetation biomass samples at the 8 HI-RES areas (week 1 & 3) • 6 vegetation biomass samples per farm every Monday at the same location • measurements of NDVI, TIR, LAI at 16 points of the HI-RES areas (once per farm) • Farm Scale Sampling • 2 vegetation “grab” samples at NW and SE corners of the HI-RES area N W E S Viviana Maggioni
Collected Data • Vegetation Dry Biomass • Vegetation Water Content • Normalized Difference Vegetation Index (NDVI) • Thermal Infra Red (TIR) • Leaf Area Index (LAI) Viviana Maggioni
_____ NIR – SWIR NDWI = NIR + SWIR Objective • VWC estimates to remotely sense VWC • Literature: T. Jackson et al. (2003) • How accurate do we need to know VWC for a given accuracy of Moisture Content of 4%? Saturation of the NDVI • extreme conditions: 0.8 kg/m² • otherwise: 1 kg/m² Viviana Maggioni
The High Resolution Focus Areas N • Dales: • Native Grass • Pembroke: • 80% Barley • 20% Native Grass • Midlothian: • 50% Fallow • 50% Lucerne • Merriwa Park: • Wheat • Illogan: • 60% Oats • 40% Barley • Stanley: • Native Grass • Cullingral: • 50% Wheat • 50% Barley • Roscommon: • Native Grass
Dry Biomass (kg/m²): Merriwa Area Viviana Maggioni
Dry Biomass (kg/m²): Krui Area Viviana Maggioni
Vegetation Water Content (kg/m²): Merriwa Area Viviana Maggioni
Vegetation Water Content (kg/m²): Krui Area Viviana Maggioni
NIR and RED Viviana Maggioni
NIR - RED NDVI = NIR + RED Normalized Difference Vegetation Index Viviana Maggioni
TIR and LAI Viviana Maggioni
MODIS NDVI Validation Viviana Maggioni
NDVI versus TIME Viviana Maggioni
NDWI versus TIME _______ NIR – SWIR1640nm NDWI1640= NIR + SWIR1640nm _______ NIR - SWIR2130nm NDWI2130= NIR + SWIR2130nm Viviana Maggioni
VWC Relationships R-squared RMSE NDVI • Native Grass • Crop 0.6998 0.0228 0.9573 0.1794 NDWI 1640 • Native Grass • Crop 0.0295 0.0654 0.7931 0.3861 NDWI 2130 • Native Grass • Crop 0.90360.0206 0.7457 0.4531 Viviana Maggioni
Dry Biomass Relationships R-squared RMSE NDVI • Native Grass • Crop 0.3531 0.0794 0.8292 0.1057 NDWI 1640 • Native Grass • Crop 0.4121 0.1165 0.5893 0.1932 NDWI 2130 • Native Grass • Crop 0.4214 0.0956 0.7881 0.1656 Viviana Maggioni
VWC & Dry Biomass versus TIME Viviana Maggioni
MODIS Data 31 OCT 1 NOV 2 NOV 3 NOV 5 NOV 6 NOV 7 NOV 8 NOV 9 NOV 11 NOV 12 NOV 13 NOV 14 NOV 16 NOV 17 NOV 18 NOV 19 NOV 21 NOV 22 NOV 23 NOV Viviana Maggioni
How many samples? Viviana Maggioni
Merriwa Park 3 0 Next Steps • Landcover map • Thumbnails of spatial VWC • Aircraft NDVI validation • Microwave Polarization Difference Index (MPDI) relationship Viviana Maggioni
Thank you Viviana Maggioni