Download
1 / 29
700 likes | 2.66k Vues
Leverage. Operating Leverage: The use of fixed operating costs as opposed to variable operating costs A firm with relatively high fixed operating costs will experience more variable operating income if sales change Financial Leverage:

E N D
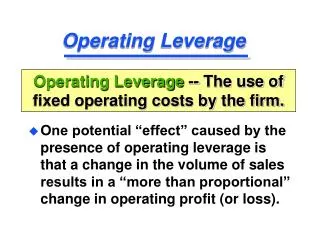
Leverage • Operating Leverage: • The use of fixed operating costs as opposed to variable operating costs • A firm with relatively high fixed operating costs will experience more variable operating income if sales change • Financial Leverage: • The use of fixed-cost sources of financing (debt, preferred stock) rather than variable-cost sources (common stock)
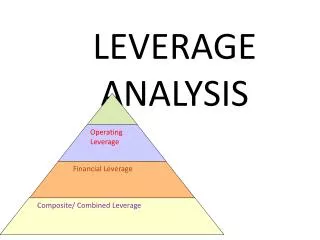
Leverage Analysis • Operating Leverage • Affects a firm’s business risk • Business risk is the variability or uncertainty of a firm’s operating income (EBIT) • Financial Leverage • Affects a firm’s financial risk • Financial risk is the variability or uncertainty of a firm’s earnings per share (EPS) and the increased probability of insolvency that arises when a firm uses financial leverage
Breakeven Analysis • Illustrates the effects of operating leverage • Useful for forecasting the profitability of a firm, division or product line • Useful for analyzing the impact of changes in fixed costs, variable costs, and sales price • Terms: • P: price per unit, Q: quantity produced, V: variable costs per unit, VC; total variable costs, F; total fixed costs, TC: total cost (VC+F), S: sales ($)
Total Revenue (PQ) $ Quantity Breakeven Analysis
Costs • Suppose the firm has both fixed operating costs (administrative salaries, insurance, rent, property tax) and variable operating costs (materials, labor, energy, packaging, sales commissions)
Total Revenue Total Cost (QV)+F or VC+F $ { FC Quantity Breakeven Analysis } + EBIT - Q1 Breakeven EBIT
Operating Leverage • What happens if the firm increases its fixed operating costs and reduces (or eliminates) its variable costs?
Total Revenue $ EBIT + Total Cost = Fixed - FC Q1 Quantity Breakeven Analysis } With high operating leverage, an increase in sales produces a relatively larger increase in operating income. Trade-off: the firm has a higher breakeven point. If sales are not high enough, the firm will not meet its fixed expenses! { Breakeven EBIT
Analytical Income Statement sales - variable costs - fixed costs operating income (EBIT) - interest EBT - taxes net income } contribution margin EBT (1 – t) = Net Income, so, Net Income / (1 – t) = EBT
Degree of Operating Leverage (DOL) • Operating leverage: by using fixed operating costs, a small change in sales revenue is magnified into a larger change in operating income • This “multiplier effect” is called the degree of operating leverage
Degree of Operating Leveragefrom Sales Level (S) • Above calculation requires two analytical income statements, one for the base period and one for the following period using the new level of sales
Degree of Operating Leveragefrom Sales Level (S) • If we have the base level data, we can use this formula: • Implicit assumption is that Variable Costs / Sales and Fixed Costs stay the constant • If DOL = 2, then a 1% increase in sales will result in a 2% increase in operating income (EBIT) and vice versa • %Δ in EBIT = DOLSales x %Δ in Sales
Degree of Financial Leverage (DFL) • Financial leverage: by using fixed cost financing, a small change in operating income is magnified into a larger change in earnings per share (EPS) • This “multiplier effect” is called the degree of financial leverage
Degree of Financial Leverage • Each financing or capital structure (relative use of debt and equity) alternative will have a different degree of financial leverage (DFL)
Degree of Financial Leverage • Instead of calculating DFL for each alternative capital structure we can use the following formula with the base EBIT and differing interest expenses • Note that interest expense would be based on how much debt is used financing the assets of the firm • If DFL = 3, then a 1% increase in operating income will result in a 3% increase in earnings per share and vice versa • %Δ in EPS = DFLEBIT x %Δ in EBIT
Degree of Combined Leverage (DCL) • Combined leverage: by using operating leverage and financial leverage, a small change in sales is magnified into a larger change in earnings per share • This “multiplier effect” is called the degree of combined leverage
Degree of Combined Leverage • If we have the base level data, we can use this formula: • If DCL = 4, then a 1% increase in sales will result in a 4% increase in earnings per share • %Δ in EPS = DCLSales x %Δ in Sales
Example • Based on the following information on a Levered Company, answer these questions: 1) If sales increase by 10%, what should happen to operating income? 2) If operating income increases by 10%, what should happen to EPS? 3) If sales increase by 10%, what should be the effect on EPS?
Levered Company – Data Sales (100,000 units) $1,400,000 Variable Costs $800,000 Fixed Costs $250,000 Interest paid $125,000 Tax rate 34% Shares outstanding 100,000
Sales DCL DOL EPS EBIT DFL Leverage
Levered Company – Base Level Data Sales (100,000 units) $1,400,000 Variable Costs ($800,000) Fixed Costs ($250,000) EBIT (Operating Income) $350,000) Interest paid ($125,000) EBT $225,000 Tax @ 34% ($75,500) EAT (Net Income) $148,500 EPS = $148,500 / 100,000 = $1.485
Degree of Operating Leverage from Sales Level (S) • Answer to part 1: • %Δ in EBIT = DOLSales x %Δ in Sales • %Δ in EBIT = 1.714 x 10% = 17.14%
Degree of Financial Leverage • Answer to part 2: • %Δ in EPS = DFLEBIT x %Δ in EBIT • %Δ in EPS = 1.556 x 10% = 15.56% • %Δ in EPS = 1.556 x 17.14% = 26.67% (cumulative impact of part 1
Degree of Combined Leverage • Answer to part 3: • Alternatively DCL = DOL x DFL • DCL = 1.714 x 1.556 = 2.667 • %Δ in EPS = 2.667 x 10% = 26.67%
Sales DCL = 2.667 DOL = 1.714 EPS EBIT DFL = 1.556 Levered Company
Levered Company10% increase in sales Sales (110,000 units) 1,540,000 Variable Costs (880,000) Fixed Costs (250,000) EBIT 410,000 ( +17.14%) Interest (125,000) EBT 285,000 Taxes (34%) (96,900) Net Income 188,100 EPS $1.881 ( +26.67%)