Download
1 / 12
120 likes | 128 Vues
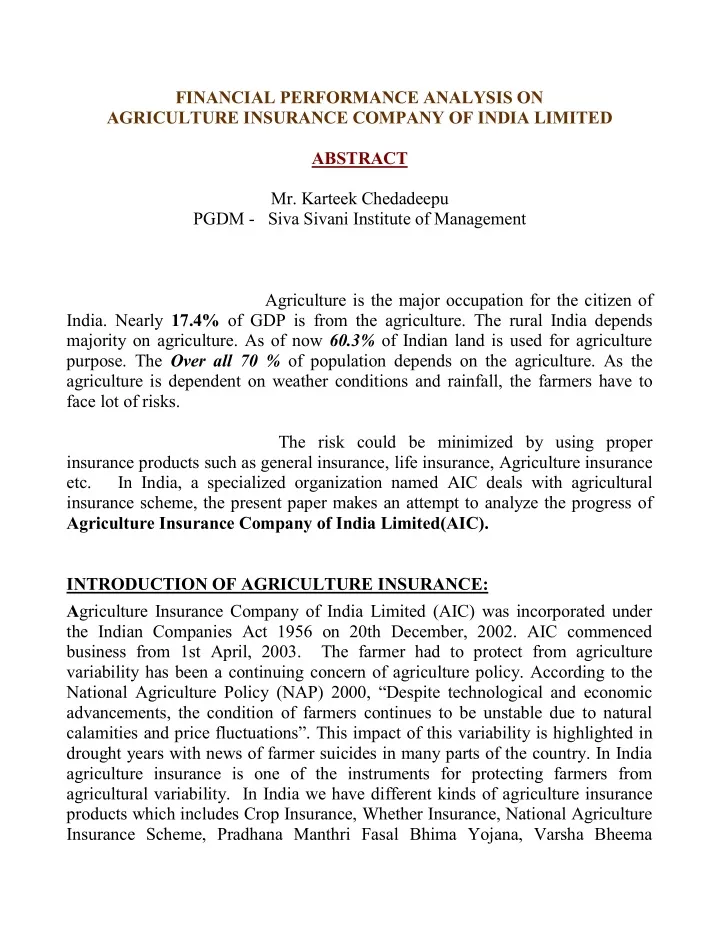
FINANCIAL PERFORMANCE ANALYSIS ON AGRICULTURE INSURANCE COMPANY OF INDIA LIMITED (AIC) - ABSTRACT

E N D
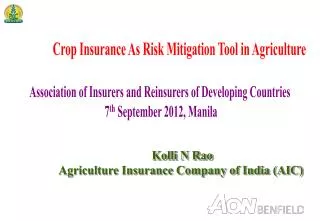
FINANCIAL PERFORMANCE ANALYSIS ON AGRICULTURE INSURANCE COMPANY OF INDIA LIMITED ABSTRACT Mr. Karteek Chedadeepu PGDM - Siva Sivani Institute of Management Agriculture is the major occupation for the citizen of India. Nearly 17.4% of GDP is from the agriculture. The rural India depends majority on agriculture. As of now 60.3% of Indian land is used for agriculture purpose. The Over all 70 % of population depends on the agriculture. As the agriculture is dependent on weather conditions and rainfall, the farmers have to face lot of risks. The risk could be minimized by using proper insurance products such as general insurance, life insurance, Agriculture insurance etc. In India, a specialized organization named AIC deals with agricultural insurance scheme, the present paper makes an attempt to analyze the progress of Agriculture Insurance Company of India Limited(AIC). INTRODUCTION OF AGRICULTURE INSURANCE: Agriculture Insurance Company of India Limited (AIC) was incorporated under the Indian Companies Act 1956 on 20th December, 2002. AIC commenced business from 1st April, 2003. The farmer had to protect from agriculture variability has been a continuing concern of agriculture policy. According to the National Agriculture Policy (NAP) 2000, “Despite technological and economic advancements, the condition of farmers continues to be unstable due to natural calamities and price fluctuations”. This impact of this variability is highlighted in drought years with news of farmer suicides in many parts of the country. In India agriculture insurance is one of the instruments for protecting farmers from agricultural variability. In India we have different kinds of agriculture insurance products which includes Crop Insurance, Whether Insurance, National Agriculture Insurance Scheme, Pradhana Manthri Fasal Bhima Yojana, Varsha Bheema
Yojana etc. This paper focuses on the use of agriculture insurance schemes to protect farmers from agricultural variability. It requires an investigation so as to sort out what are the important factors affecting profitability of agriculture insurance company and this will help concerned bodies to focus on the relevant factors. Hence the efficient performance of the institutions has become important and getting insights by different researchers focus on what factors determine the financial performance of the agriculture insurance company sector. The insurance premiums for different types of crops are as follows: 3.5 per cent of sum insured for Bajra and Oilseeds 2.5 per cent of sum insured for Cereals, other Millets and Pulses Apart from this 50 percent of subsidies in premium are allowed to small and the marginal farmers. EVOLUTION OF AGRICULTURE INSURANCE IN INDIA In year 1915 before independence, J.S. Chakravarthi of Mysore State had proposed a rain insurance scheme for the farmers. In the year 1962, Govt has introduced a Crop Insurance Bill and a Model Scheme of Crop Insurance. In 1970, the draft Bill and the Model Scheme were referred to an Expert Committee headed by Dr. Dharm Narain. FIRST CROP INSURANCE IN INDIA: The first crop insurance program was introduced in 1972-73 by the 'General Insurance' Department of Life Insurance Corporation of India Iin 19947-1948 where a study on homogeneous areas that deals with a single unit and individual farmers irrespective of individual crop. The crop insurance was circulated by central government. In 1971 crop insurance was not introduced because of financial non variability the chairman of committee dhram decline the crop insurance in 1976 this was strongly encouraged. This experimental scheme was based on "Individual Approach". It continued up to 1978-79 and covered only 3110 farmers for a premium of 4.54 lakhs against claims of 37.88 lakh.
Pilot Crop Insurance Scheme (PCIS) – 1979 Proff. Vm dandekar refereed as “father of crop insurance in India” he suggested “homogeneous area approach” for crop insurance. General Insurance Corporation of India (GIC) introduced a Pilot Crop Insurance Scheme (PCIS) from 1979. This scheme covers the cereals, millets, oilseeds, cotton, potato, gram and barley. This scheme ran till 1984-85 by which 13 States had participated. Name Agriculture Insurance Comprehensive crop insurance Experimental crop insurance National agriculture insurance scheme Of The Policy Under Time PeriodRate 1985-1997 1997-98 1997-2000 Premium fixed 2% 1.5 percent to 3.5 percent of sum assured for food crops Pilot scheme on seed crop insurance 2000 Farm income insurance scheme 2003-04 Pradana manthri fasal bhima yojana 2016 February 2%rabi 2.5% karif These are comes under the agriculture insurance companies present and future Potato crop insurance Bio fuel/plant insurance Ply wood tree insurance Sugar cane insurance Tea insurance Pulp wood tree insurance policy Rubber plantation insurance Restricted weather based crop insurance scheme
PERFORMANCE OF AGRICULTURE INSURANCE: Natural calamities and adverse seasonal conditions are grossly impacted the level of agriculture productivity. Nearly 65% of Indian agriculture is heavily dependent on natural factors, particularly rainfall. Crop loss can be reimbursed through proper weather risk management. Management of weather risk deserves top priority in the government agenda. Since 1985,when comprehensive crop insurance scheme was started who replaced by National Agriculture Insurance Scheme (NAIS) in1999. The NAIS was introduced on a large scale to provide insurance coverage to farmers against weather risk. State-wise Number and Percentage of farmers Covered under National Agriculture Insurance in India (2007-2008). After analyzing the above table, we can say that NAIS has performed well in the states of Rajasthan, Chhattisgarh, Andhra Pradesh, Gujarat, Madhya Pradesh, and Orissa. In the states of Assam, Bihar, Goa, Haryana, Himachal Pradesh, Kerala, Meghalaya, Sikkim, Tripura, Jammu & Kashmir etc. the numbers of farmers covered are very less in number. So, only a few numbers of states has taken the benefits from NAIS. OBJECTIVE OF STUDY: The main objective of study is to know the financial performance of the agriculture insurance company. How many farmers were insured, from sum of amount. And it can know the analysis from the data. REVIEW OF LITERATURE: Iftt 2001, analyzed a story of crop insurance, it was started by introducing comprehensive insurance scheme (CCIS) in 1985. High percentage of claim premium, high moderate cost, mandatory for Lonee form Jennifier iftt(2004), It with drawn from crop insurance it support from an income guarantee scheme or risk management tool, investment tool. Shina 2004, A study of interstate companies with respect to crop insurance in india general insurance company manage crop it was delivered through rural financial institutions. Aic was formed taken over the role of the implementing agency from GIC. From analysis it shows an AIC cannot bare risk and gives poor interest in controlling moral hazards private company will bear all risk.
Kalavakonda and mahul, Studies on the demand for crop insurance good win 1993. Analyze the demand for multiple peril crop insurance of lowa corn producers by taking 99 lowa countries 1985- 1990 Gowdappa, Sb reddy &Chendra shekar(2012), Farmer perception and awareness about crop insurance. In Karnataka the study on farmer study rain in north east part of Karnataka the region receives a very less rain fall compares to others. Suresh kumara, Barabh, ranganathan, venkatarama (2011), An Analysis of farm perception and awareness towards crop insurance as a tool for risk management. Crop diversification index has also been used to examine the farmers adjust mechanism against the risk. The survey has revealed the 65%of farmers are awake of risk mitigation and half of farmers awake of crop insurance. RESEARCH METHODOLOGY: Descriptive research methodology is carried out in this paper. It is mainly based on the secondary data collected from various sources. We have also used some primary data which is collected by telephonic talk and interviews of the farmers, entrepreneurs. Different research articles reports have been reviewed to make this study more relevant
DATA ANALYSIS Table 1: Particulars2009-102010-11 Gross Direct Premium Growth Rate Gross Direct Premium to Net Worth Ratio Net Retention Ratio Net Commission Ratio Expenses of Management to Gross Direct Premium Ratio Combined Ratio Underwritin g Balance Net Earnings Ratio Available Solvency 2011-20122012-13 32.14 2013-14 29.6 2014-15 -19.30% 82.42% 28.26 27.96 196.95 173.09 186.60 189.06 1.7 1.28 83.43 65.81 52.67 48.38 50.08 54.62 -3.49 -9,89 -17.43 -13.95% -10.13% -4.56 1.7 2.78 2.38 2.37 2.89 3.70 93.95 75.89 60.48 79.51 98.24 108.55 -11.24 32.11 36.8 14.7 0.02 -0.09 29.63 21.83 14.62 11.23 2.63 37 2.07 3.71 3.18 2.47 2.6 3.18
35 30 25 2009-10 2010-11 2011-2012 2012-13 2013-14 2014-15 20 15 10 5 0 Gross Direct Premium Growth Rate -5 0 2010-2011 2012-13 2014-15 -2 2009-10 -4 2011-12 2013-14 -6 -8 Net Commission Ratio -10 -12 -14 -16 -18 -20
90 100 80 Net Retention Ratio 90 70 60 80 50 70 40 60 30 20 50 10 Combined Ratio 40 0 2009-10 2010-2011 2011-12 30 2012-13 2013-14 2014-15 20 10 0 1 2 3 4 5 6 90 Net Retention Ratio 80 70 60 50 40 30 20 10 0 2010-2011 2011-122012-13 2013-142014-15 2009-10 Expenses of Management to Gross Direct Premium Ratio 3 2.5 2 1.5 1 0.5 0 2009-10 2010-2011 2011-12 2012-13 2013-14 2014-15
40 Net Earnings Ratio 35 30 25 20 15 10 5 0 2009-10 2010-2011 2011-12 2012-13 2013-14 2014-15 Available Solvency Margin Ratio to Required Solvency Margin Ratio* 4 3.5 3 2.5 2 1.5 1 0.5 0 2009-10 2010-2011 2011-12 2012-13 2013-14 2014-15 40 Underwriting Balance Ratio 30 20 10 0 2009-10 2010-2011 2011-12 2012-13 2013-14 2014-15 -10 -20
INTERPRETATION OF THE TABLE: The gross domestic premium have an increase in the 2011 and there is a Change in 2015 .the net retention period has slightly decreased year. The net commission period has slightly decreased and increased in 2015. The combined ratio has gradually increased. Net earnings ratio has been gradually increased and decreased slightly. Under write of balance ratio starts with negative. And there is a slight increased and it came to negative points. Agricultural Insurance : Current Status According to agriculture insurance, the current status of the crops insurance that can be explained in a table in the form of rabi and karif for the 2011-15 Rabi crop insurance for 2011-15 TABLE 2: Rabi 2010-11 Rabi 2011- 12 Sum insured Rabi 2012-13 Rabi 2013- 14 year No of farmers insured Sum insured No of farmers insured No of farmer s insured 496787 8 523929 9 Sum insured No of farmer s insured - Sum insured 2011-12 16.67 1,128 crore 4.17 lakh - 1,128 crore - 1101055. 6 1128393. 6 - 2012-13 5.97 1,531 cror 523929 9 1128393.6 3 2013-14 - - 20.37 crore - 283458 crore - 613671 3 - 1570211. 6 - 614167 7 397358 8 1571008.0 5 1255204.1 2014-15 -- -
Karif crop insurance for 2010-15 karif 2011 Sum insured karif 2012 Sum insured karif 2013 Sum insured karif 2014 Sum insured year No of farmers insured No of farmers insured(C R) 18.76 No of farmers insured No of farmers insured 2011-12 - - 2,44,68 0 283458 1064540 1155456 1 2348710. 3 2718136. 05 2979601. 57 - - - 2012-13 - - 106493 54 974960 0 968352 9 2719906 20.37 5 2013-14 - - - - 1032240 1 - 2900218. 3 2438783. 9 2014-15 - - - - Graphical representation: 7000000 6000000 5000000 4000000 farmers insured sum farmers insured sum 3000000 2000000 1000000 0 1,128 crore 4.17 lakh 1,128 crore - - 283458 crore 20.37 crore 1,531 cror 14000000 12000000 10000000 8000000 farmers insured 2013-2014 sum 2014-15 farmers insured sum 6000000 4000000 2000000 0 2,44,680 crore. 18.76 crore 283458 crore 20.37 crore - -
Interpretation of the Graph: In 2010-11, no of farmers were insured 16.67 for sum 1,128 crore. In the uear 2011-12. These are the farmers were insured 4.17 lakh, for sum of the 1,128 crore. In the uear 2021-13. These are the farmers were insured 6136713 for sum of the 11570211.6. In the uear 2014-15. These are the farmers were insured 3973588, for sum of the 1255204.1. Karrif: in 2013-14 there is a gradual increase in the table, as compared to al karif seasons in 2015-15 have a no of farmers were insured, these graph shows there is an increased in the karif season CONCLUSION: We can know the financial performance of the agriculture insurance company, by this we can know the how many farmers are insured. And the growth of the company. It explains the less risk to farmers if they were insured. References:- 1. Agriculture Insurance company of India Limited retrieved from www.aicofindia.org 2.Insurance Regulatory and Development Authority of India from www.irdai.gov.in 3. Dandekar V.M.(1985), crop Insurance in India: A Review, Economic and Political Weekly, 4. Rustogi N.K.(1988) Crop Insurance in India, B.R. Publishing co. Ltd., new Delhi 5. Sinha Sidharth (2004), Agriculture Insurance in India: Scope for participation of private insurers, Economic and Political Weekly, June 19, 2004 6. Government of India(1999) National Agriculture Insurance Scheme, ministry of Agriculture, New Delhi