Download
1 / 137
1.45k likes | 1.72k Vues
Univariate Statistics. LIR 832 Class #2 September 15, 2008. Topics for Next Four Lectures. Fundamental Problem in Statistics: Learning about populations from samples Describing Data Compactly: How we might describe data, why compactness matters.

E N D
Univariate Statistics LIR 832 Class #2 September 15, 2008
Topics for Next Four Lectures • Fundamental Problem in Statistics: Learning about populations from samples • Describing Data Compactly: • How we might describe data, why compactness matters. • Measures of Central Tendency (what are they, when to use them) • Measures of dispersion • Probability Distributions: • As samples are hopefully random draws from populations, we need to understand the likelihood of drawing samples. This leads us to a review of some basic probability distributions. • Inference from Samples to Populations: • Sampling Distributions and the Central Limit Theorem • Estimation • Hypothesis Testing
Basic Issues in Statistics • Populations and Samples: Generally wish to know about populations • What is a population? • How do we count a population? • What types of populations would you be concerned with in your professional life?
Basic Issues in Statistics • Use of Samples to Learn about Populations • What is a sample? • representative sample • random sample • convenience sample • Why use samples rather than populations? • less time consuming to collect • less expensive to collect • often more accurate than census • population may not exist at the time data is collected
Basic Issues in Statistics • Samples are affected by randomness, two samples drawn from a population are unlikely to be identical (sampling variability) and neither is an exact reproduction of the population. • What is meant by random? • An event is random if, despite knowing all of the possible outcomes in advance, we are not able to exactly predict a particular outcome. • experiment: M&M issue • Samples are, to some degree, random • different samples produce different estimates • sample mean may be different than (but close to) population mean
Basic Issues in Statistics • Since sample is not an exact reproduction of the population, we need to allow for sampling variability in using samples to tell us about populations. • What types of HR/IR issues might involve the use of samples?
Example: Training Program • We are interested in a training program which is supposed to improve productivity. It would be very expensive to implement throughout a firm, particularly if it doesn’t work. Instead, we set up an experiment in which we try the program on a sample of employees at a single location (this may be called a pilot program).
Example: Training Program • We experiment with a pilot program and find that productivity rose by 2% Our problem in using the pilot (sample): if we replicate the pilot throughout the firm is it reasonable to believe that: • we will get a 2% boost in productivity, or • This could this just be the result of getting a “good” sample (Folks who happened to respond favorably to the program). • Our core problem in using samples is distinguishing between systematic effects of programs and chance outcomes
Example: Turnover • You run human resources for a large low wage manufacturing plant. Your firm has established that there should be a 2.5% turnover rate per month and has a policy that turnover rates above 2.5% are evidence of ineffective human resource programs. • You have kept your turnover rate at 2.4% per month for the last year and one half. Last month and this month that rate has shot up to 3.2%. Is this evidence that you are not doing your job as a human resource manager?
What is Data? • Answer: The numeric representation of the characteristics of an individual, object or experiment. • You, as an individual, provide multi-dimensional data: • Quantitative: • Age • Height • Your pre-class views on LIR 832 • Qualitative: • Gender • Educational Attainment • Occupation • Economic Data: • Income • Debt • Expected Income on graduating from this program.
What is Data? • You are multi-dimensional. We may be very interested in the relationship between your characteristics: • Gender and Educational Attainment with expected income • Blood pressure with age • Data can also be collected on plants, establishments and firms as well as by political or geographic entity. • Firm: Revenue, Operating Costs, Debt to Equity Ratio, Number of Employees, Number of Locations, Distribution of Occupations, Presence of Program to Encourage Diversity in the Labor Force
What is Data? • We are typically interested in variables, data which vary across ‘individuals’ or ‘units of observation. • age, gender, income vary across individuals in this class • revenue, profit (and so much more) varies across divisions of General Motors • Some characteristics do not vary in a given data set. For example, all of you will have the same level of educational attainment, a masters degree, when you graduate. Such characteristics are called constants. In contrast, level of education will vary in a survey of MSU graduates
What is Data? • Some of the difference in individual outcomes in variables is systematic (predictable), some is random. • There is systematic difference in earnings by gender & education • Still, if we take women graduates of this program with three years of post graduation experience there will be considerable differences in annual earnings. Much of this is random in the sense that we could not predict it in advance.
Types of Data • Qualitative or nominal data: • The numeric values indicate qualitative states but does not indicate rank or any arithmetic relationship. • northeast = 1/midwest = 2/south = 3/west = 4 • White =1/Black =2/Asian-Pacific Islander = 3 • The numeric values designate a qualitative outcome but they could be changed around without any loss of information. E.G.: • northeast = 20/midwest = 100/south = -3/west = 41,298 • White =1/Black =20/Asian-Pacific Islander = 3000
Types of Data • Ordinal or ranked data: • Likert scale: (subjective) • 2 = strongly dislike/ -1 = dislike/ 0 = like/ 1 = strongly like • Income: (objective) • 0 - income under $4,999 per year • 1 - income from $5,000 to $9,999 • 2 - income from $10,000 to $14,999 • The values of the data designate a ranking or order and we can tell if the outcomes are =, > or < but we cannot perform arithmetic operations.
Types of Data • Cardinal Data (also called interval or ratio data): we can apply arithmetic operations to this data (=, >, < +, -, x, ÷). There can be values of 0 as well as negative values. • weekly earnings • age • number of absences last week
Summarizing Data • The Problem of Compactly Describing Populations • Ages of students in the class (33 observations on age from 2004): 25 37 26 25 51 37 27 21 39 22 23 27 22 22 23 25 25 22 22 24 23 32 23 25 27 21 27 23 22 23 24 31 22
Summarizing Data • Possible first step to summarize: Calculate a range. • Example: Class Age Data • Range: 30 (from 21 to 51) • Example: Frito-Lay HR Metrics • Range: 27.64% (from 1.00% to 28.64%)
Summarizing Data • Another possible solution: Histogram • One option: Create table of absolute and relative frequencies. Age Distribution of LIR 832 on Wednesday August 29, 2005 AGE Absolute Frequency Relative Frequency 20 to 24 17 .515 (= 17/33) 25 to 29 10 .303 (= 10/33) 30 to 34 2 .061 (= 2/33) 35 to 39 3 .091 (= 3/33) 40 to 44 0 0 45 to 49 0 0 50 to 54 1 .030 (= 1/33)
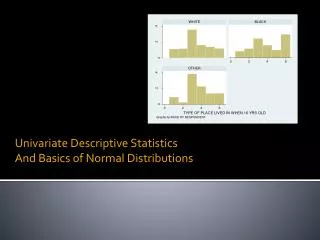
Summarizing Data • Another option: Graph histogram
Summarizing Data • Graph of Frito-Lay HR Metrics:
Measures of Central Tendency • Measures of central tendency: (Mode, Median & Mean) • Extremely compact, a single measure is used to represent useful information about possibly large bodies of data. • Examples: • Mean unemployment rate • Average turnover (number or rate) • Average earnings • Health care program most commonly chosen by employees.
Class Age Data (Ordered) 21 21 22 22 22 22 22 22 22 23 23 23 23 23 23 24 24 25 25 25 25 25 26 27 27 27 27 31 32 37 37 39 51
Measures of Central Tendency • Mode - the most common or frequent outcome • In the class age data the mode is:_________ • Not necessarily unique • Can be computed for all types of data • Important method in advanced statistical analysis (maximum likelihood estimation)
Measures of Central Tendency • Median - the middle (or central) observation if observations are ranked from largest to smallest • In the class age data the median is:______ • Median is unique • Can be computed for cardinal and ordinal data • Uses only the central observation • Insensitive to outliers. • Median (w/ 51 year old) = median (w/out) = 24
Measures of Central Tendency • Mean - average observation accounting for value of observations. It is the sum of all observations divided by the number of observations. • Mean - sum of all observations divided by the number of observations
Measures of Central Tendency • Class Age: Population Mean for 33 Students: μage = 868/33 = 26.3 • All cardinal data has a mean (but ordinal and qualitative doesn’t) • Uses all of the data in the calculation. • Only one mean • Represents the balance point of the data • Sensitive to outliers. • Remove our 51 year old from the data: μ = 25.8
Measures of Central Tendency • Q: When Should We Use a Mode, a Median or a Mean? • A: Our goal is to give the reader an idea of the “typical” outcome • Mode: lovely when there are a few possible outcomes and you want to indicate which is most popular. • Which medical plan among five is chosen most frequently by our employees? • Not so good when you have 10,000 outcomes and there are few duplicates. The mode doesn’t really tell you very much (see our class age and Frito-Lay HRM data). • Model approaches lead fairly quickly to pie chart presentations as these quickly summarize information on matters such as “portion participating”.
Measures of Central Tendency • Mean: good because is summarizes so much data but can be sensitive to outliers and can average across important distinctions. • Consider two samples of annual income: one with Bill Gates, one without Bill Gates. • Consider the following data on five employees blood pressure. • Normal High • 80 150 • 83 170 • 75 • What is the average blood pressure among our employees? If 120 is a cut off between normal and high blood pressure, does the mean help us to understand health issues among employees in our firm?
Measures of Central Tendency • Median: good because it is invariant to outliers, but it doesn’t use data very efficiently. Unless the data is skewed, the mean uses a lot more data efficiently than medians and we can develop measures of dispersion for means.
Measures of Central Tendency • Geometric or Harmonic Means: • A type of mean that we won’t use very much in this course • Suppose we have a problem in which we are calculating the return to an investment over time in which the return is • year 1 5% • year 2 10% • year 3 12% • So your equation for calculating your return on principle would be: principle*(1.05)*(1.10)*(1.12)
Measures of Central Tendency* • What is the mean rate of return? If we used our arithmetic mean, we would get: (5% + 10% + 12%)/3 = 9%. • This is wrong because it doesn’t allow for compounding. The correct method of calculating the mean is • This is pretty close to the arithmetic mean, but if we averaged: 10%, 11%, 12%, 13%, 14%, 15%, 100% interest rates: • arithmetic mean: 23.7% • Geometric mean: 26.2%= • The geometric mean is the root of the number of values you multiply to get your final result
Dispersion • A story of labor relations specialists and TV reporters: • While the average may be the same, obviously the two jobs are not the same in terms of pay. So we need to have a statistic that can tell us whether the numbers are close together, as with HR managers, or spread out, as with TV Broadcasters.
Dispersion • Another example. Average Temperatures in East Lansing and Mercury are similar 65○F vs 63.7○F. However, the dark side of mercury is close to absolute zero Kelvin and the sun side is around 350○F. The mean temperature in E.L. conveys much more useful information than does the mean for mercury.
Dispersion • Dispersion: What is it, how do we measure it? • Dispersion is very important if we are using samples to learn about populations. Randomness in sampling results in sample means being dispersed around the population mean. As a result, we don’t believe that sample statistics exactly reproduce population characteristics. If we are going to use samples, we need to figure out how to handle this dispersion (sampling variability). • Most people are comfortable with measures of central tendency, but not with dispersion. Witness Human Resource Dashboards.
Dispersion • Issue: • How close is a typical observation to the mean? • How much information does our mean contain?
Dispersion • Variance and Standard Deviation: • Dispersion is more about distance than direction. Move to using a distance measure • Need a measure which is • A measure of distance (don’t want sign) • In the same units as the underlying data • Mathematically tractable
Standard Deviation • All Very Nice, so what do we do with Standard Deviation? • We could work with the empirical rule or Chebychev’s (or is it Tschebychev’s) inequality • This would give us a taste of what we will learn when we work with the normal distribution and the Central Limit Theorem. Since we are moving fast, we will put these aside and wait until we get there next week. • For the moment, we have a couple measures of dispersion, we don’t really know what they mean.
Probability Distributions • Return to our fundamental problem: using samples to learn about unobserved populations • Samples are random (hopefully) draws from populations, we need to understand the likelihood of drawing a particular samples. • Our understanding of randomness is based on probability theory. Probability theory is used to understand events where all possible outcomes are known in advance, but where it is not possible to predict the actual outcome with certainty. • Drawing a particular hand in a poker game • How many employees will be absent tomorrow • The profitability of your department in the next quarter.
Probability: Terminology • Experiment: An experiment: an action whose outcome cannot be known with certainty in advance • Flip a coin three times and count the number of heads • The number of employees absent on a given day. • The consequences of ... • Event: the outcome of an experiment. It cannot be predicted exactly in advance, but we can predict the distribution of the outcomes for large numbers of trials. • The number of heads on three flips • The number of employees absent • A probability is the likelihood that a particular event, or set of events, will occur in the future. • A probability distribution is a list of all the outcomes (events) of an experiment and their probabilities.
More on Probability Distributions • A listing of events and the likelihood that those events will occur. • Flip a coin three times and count the number of heads: • Heads Probability: • 0 1/8 • 1 3/8 • 2 3/8 • 3 1/8 • Note: 0 ≤P ≤1