Download
1 / 33
330 likes | 633 Vues
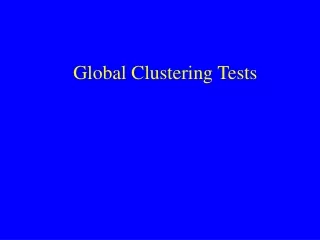
Tests for Spatial Clustering. global statistic aggregate / points k-function Grimson’s method Cuzick & Edward’s method Join Count aggregate data Geary’s C Moran’s I local statistic spatial scan statistic LISA statistic geographical analysis machine (GAM). K - Function.

E N D
Tests for Spatial Clustering • global statistic • aggregate / points • k-function • Grimson’s method • Cuzick & Edward’s method • Join Count • aggregate data • Geary’s C • Moran’s I • local statistic • spatial scan statistic • LISA statistic • geographical analysis machine (GAM)
K - Function • summary of local dependence of spatial process -> second order process • expresses number of expected events within given distance of randomly chosen event
TB Case-Control Study in Central North Island of NZ cases = redcontrols = blue
Local Spatial Autocorrelation Local Moran Local Geary
Spatial Scan Statistic • no pre-specified cluster size • can take confounding into account • also does time - space clustering • method • increasing circles (cylinders if including time) • compare risk within with outside circle • most likely cluster -> circle with maximum likelihood (more than expected number of cases) • SaTScan software (public domain)
Example - SaTScan • locations of den sites of tuberculous and non-tuberculous possums
Example - SaTScan cont. MOST LIKELY CLUSTER 1. Coordinates / radius..: (348630,708744) / 126.65 Population............: 56 Number of cases.......: 34 (16.44 expected) Overall relative risk.: 2.07 Log likelihood ratio..: 15.86 P-value...............: 0.001 SECONDARY CLUSTERS 2. Coordinates / radius..: (348491,708496) / 33.35 Population............: 5 Number of cases.......: 5 (1.47 expected) Overall relative risk.: 3.41 Log likelihood ratio..: 6.25 P-value...............: 0.337 3. Coordinates / radius..: (348369,708453) / 80.55 Population............: 8 Number of cases.......: 7 (2.35 expected) Overall relative risk.: 2.98 Log likelihood ratio..: 6.13 P-value...............: 0.365
Space-Time Scan Statistic MOST LIKELY CLUSTER 1.Census areas included.: 75, 26, 77, 76, 29, 32 Coordinates / radius..: (389631,216560) / 59840.47 Time frame............: 1997/1/1 - 1999/12/31 Population............: 4847 Number of cases.......: 1507 (632.85 expected) Overall relative risk.: 2.38 Log likelihood ratio..: 509.4 Monte Carlo rank......: 1/1000 P-value...............: 0.001
Framework for Spatial Data Analysis Attribute data Feature data Databases GISDBMS Visualization Maps Describe patterns Exploration StatisticalSoftware Test hypotheses Modelling
Modelling • explain and predict spatial structure • hypothesis testing • methods • data mining • statistical and simulation modelling • multi-criteria/multi-objective decision modelling • problem -> spatial dependence
3D Risk Map for FMD Outbreak Occurrence in Thailand(based on random effects logistic regression analysis)
Recent Developments in Spatial Regression Modelling • generalised linear mixed models (GLMM) • use random effect term to reflect spatial structure • impose spatial covariance structures • Bayesian estimation, Markov chain Monte Carlo (MCMC), Gibbs sampling • autologistic regression • include spatial covariate • MCMC estimation
Bayesian Regression Modelling • Bayesian inference • combines • information from data (likelihood) • prior distributions for unknown parameters • to generate • posterior distribution of dependent variable • allows modelling of data heterogeneity, addresses multiplicity issues
TB Reactor Risk Modelling • dependent variable -> observed TB reactors per county in 1999 in GB • Poisson regression model • MCMC estimation • expected no. TB reactors • two random effects (convolution prior) • spatial – conditionally autoregressive (CAR) prior • non-spatial – exchangeable normal prior
Raw Standardised Morbidity Ratio BUGS softwarewith GeoBUGS extension
Raw SMR and Posterior Relative Risk Maps Bayes’ RRestimates raw SMR
Relative Importance of Structured versus Unstructured Random Effect
Multi-Criteria Decision Making using GIS • decision -> choice between alternatives • vaccinate wildlife or not • criterion -> evidence used to decide on decision • factors and constraints • presence of wildlife reservoir • cattle stocking density • access to wildlife for vaccine delivery • decision rule -> procedure for selection and combination of criteria
Multi-Criteria Decision Making in GIS cont. • evaluation -> application of decision rules • multi-criteria evaluations • boolean overlays • weighted linear combinations • uncertainty • database uncertainty • decision rule uncertainty -> fuzzy versus crisp sets • decision risk -> likelihood of decision being wrong -> Bayesian probability theory, Dempster-Shafer Theory
Dempster - Shafer Theory • extension of Bayesian probability theory • data uncertainty included in calculation -> belief in hypothesis not complement of belief in negation (sensitivity of diagnosis) • collect different sources of evidence for presence/absence (data, expert knowledge) • re-express as probability • combine evidence as mass of support for particular hypothesis
More about Dempster-Shafer Theory • belief • total support for hypothesis • degree of hard evidence supporting hypothesis • plausibility • degree to which hypothesis cannot be disbelieved • degree to which conditions appear to be right for hypothesis, even though hard evidence is lacking
Even more about Dempster-Shafer Theory • belief interval • range between belief and plausibility • degree of uncertainty in establishing presence/absence of hypothesis • areas with high belief interval suitable for collection of new data
Example – East Coast Fever Occurrence in Zimbabwe Belief interval for T.parva Presence(Degree of uncertainty) Belief in T.parva Presence
Landscape Structure • quantify landscape structure/composition • habitat features as a whole
Framework for Spatial Data Analysis Attribute data Feature data Databases GISDBMS Visualization Maps Describe patterns Exploration StatisticalSoftware Test hypotheses Modelling
Conclusion • spatial analysis essential component of epidemiological analysis • key ideas • visualization -> extremely effective for analysis and presentation • exploration -> cluster detection methods (beware of type I error) • modelling -> Bayesian modelling and decision analysis techniques