Download
1 / 86
900 likes | 1.09k Vues
The Action Planning Process. 2009 Superintendents’ Summer Institute. Elizabeth A. Jankowski Research Assistant Center on Teaching & Learning Professional Development and Outreach College of Education. Session Goals.

E N D
The Action Planning Process 2009 Superintendents’ Summer Institute Elizabeth A. Jankowski Research Assistant Center on Teaching & Learning Professional Development and Outreach College of Education
Session Goals • Provide a method for analyzing school achievement data at a more detailed level. • Provide a method of matching actions to data at a schoolwide level or grade level. • Examine a Schoolwide Plan to organize these changes.
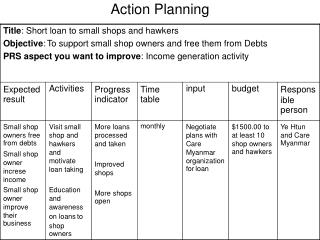
Key Concepts and Vocabulary • Action Planning: • typically done at the school level. • results in an Action Plan written by the school leadership team. • allocates resources including the budget, schedule, assignment of personnel, school-wide assessments, role of the coach, etc.
Key Concepts and Vocabulary • Action Planning: • ideally takes place in early summer so that arrangements for use of new materials or additional professional development can be made. • should be adjusted when mid-year data comes out.
Key Concepts and Vocabulary • The Action Plan: • is a specific step-by-step plan to improve student achievement. • is developed in response to grade and group level data rather than individual student data. • is developed by determining the possible cause(s) of inadequate grade level and/or group performance
Action Plans vs. Instructional Plans • Action Plan: Changing the System • An improvement plan based upon data and an analysis of the schoolwide instructional system • Adjusted in response to data 1-2 times a year • Instructional Plan: Working Within the System • A plan for small groups or individual students whose needs are not fully met by the schoolwide system • Adjusted frequently in response to data as needed
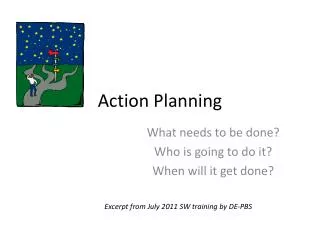
Steps in the Action Planning Process • Gather and Display Adequate Progress Data • Analyze Data to Determine Groups that Did Not Make Adequate Progress • Prioritize Creation of Action Plans • Create Action Plans
Key Concepts and Vocabulary“Adequate Progress” Defined • A term used to describe students’ movement along the achievement continuum. • Grade Level (GL): Students who meet grade level expectations in RF progress monitoring assessments, outcome assessments, and in-program assessments. • Some Risk (SR): Students who come into a grade somewhat below grade level. • High Risk (HR): Students who enter a grade level significantly behind. These students have not learned many of the prerequisite skills assumed by the grade level comprehensive reading program.
“Adequate Progress” Defined • All Grades Starting Year at Grade Level: • Must remain at Grade Level status • All Grades Starting Year at Some Risk • Must move to Grade Level status by end of year • Grades K-1 High Risk: • Must move to Grade Level status by end of year • Grades 2-3+ High Risk: • Must move to Grade Level or Some Risk status by end of year
FALL WINTER SPRING High Risk K-1 High Risk 2-3 Some Risk At or Above Grade Level “Adequate Progress” Summarized
Twelve Status Groups Quiz
Step 1:Gather and Display Adequate Progress Data • Collect School Level Data FromEach Grade Level: • The percent and number of students who made adequate progress (Grade Level, Some Risk, High Risk). • The percent and number of students performing at grade level in the end-of-year progress monitoring measurement and end-of-year state outcome assessment.
38 8 84 16 88 7 7 1 20 2 75 9 32 6 69 9 80 8 0 0 50 3 67 16 54 23 40 19 30 11 37 10 59 19 47 17 48 20 38 16 19 13 10 15 10 12 2 6 24 21 19 8 42 42 48 48 37 37 32 32 Example: Summary of School Data XYZ Elementary 6/25/09
% # % Number % # % # % # % # Example: Summary of State Data 67% 375/561 82% 611/747 95% 761/799 23% 28/124 45% 126/280 80% 1470/1843 41% 106/261 43% 292/683 94% 1204/1278 34% 112/334 44% 349/787 95% 985/1042
Step 1:Gather and Display Adequate Progress Data • Where do I get this data? • DIBELS: Summary of Effectiveness Reports • Any other assessment that is administered at least three times a year to all students can be used with the assistance of Excel
Data Farming Option DIBELS Data Excel
Other Data: Can Be UsedExample Excel • (3) = Grade Level • Input Cutoff Scores • (2) = Some Risk • Input Cutoff Scores • (1) = High Risk • Input Cutoff Scores
Steps in the Action Planning Process • Gather and Display Adequate Progress Data • Analyze Data to Determine Groups that Did Not Make Adequate Progress
Step 2:Analyze Groups to Determine Groups Not Making Adequate Progress • Analyze data to determine areas of strength and concern among groups. • Groups of students not making adequate progress. • Grade levels with too small a percentage reaching grade level reading performance (outcome data).
Step 2:Analyze Groups to Determine Groups Not Making Adequate Progress • No set expectations for making these decisions. Useful Guidelines: • “Grade Level” Students: • Nearly all students at each grade level should remain at grade level throughout the school year. • “Some Risk” Students: • Large majority of Some Risk students should move to “Grade Level” status by the end of the school year.
Step 2:Analyze Groups to Determine Groups Not Making Adequate Progress • “High Risk” Students: • K/1 - Data shows schools providing instruction with enough intensity can move a large majority of “High Risk” K-1 students to Grade Level in one year. • 2/3 - Students may be very far behind at beginning of year. Reasonable to assume they will need two years of work to catch up to grade level.
% # % Number % # % # % # % # Summary of State Data 67% 375/561 82% 611/747 95% 761/799 23% 28/124 45% 126/280 80% 1470/1843 41% 106/261 43% 292/683 94% 1204/1278 34% 112/334 44% 349/787 95% 985/1042
38 8 84 16 88 7 7 1 20 2 75 9 32 6 69 9 80 8 0 0 50 3 67 16 54 23 40 19 30 11 37 10 59 19 47 17 48 20 38 16 19 13 10 15 10 12 2 6 24 21 19 8 42 42 48 48 37 37 32 32 Practice Example: Summary of School Data XYZ Elementary 6/15/09
Analyze Groups to Determine Groups Not Making Adequate Progress Action Planning: Groups Needing Action Plans
Steps in the Action Planning Process • Gather and Display Adequate Progress Data • Analyze Data to Determine Groups that Did Not Make Adequate Progress • Prioritize Creation of Action Plans
Step 3:Prioritize Creation of Action Plans • Record order in which group action plans will be written. • Begin with groups that have most children. • Place emphasis on all Grade 1 groups. • Place emphasis on second and third grade groups at High Risk. • In some cases, two groups can be combined into one action plan if common features are noted.
Prioritizing Groups for Action Planning Action Planning: Prioritization List
Steps in the Action Planning Process • Gather and Display Adequate Progress Data • Analyze Data to Determine Groups that Did Not Make Adequate Progress • Prioritize Creation of Action Plans • Create Action Plans
1 4 3 2 5 6 Create Action Plans Define the Problem What is the problem? Evaluate How well did the Action Plan work? Conduct Problem Analysis Why is it happening? Problem Solving Process Implement the Plan How will we ensure all steps in the Action Plan have been implemented? Determine the Goal How well do we want our students to perform? Develop the Plan What will we do about it?
Problem Solving Process 1 Create Action Plans Define the Problem: • Problem is defined as the difference between what is expected and the actual performance. (Data-Based Definition)
Problem Solving Process Create Action Plans • Example Definition From One School: “90% of our first grade students at Grade Level status at the beginning of the school year were expected to remain at Grade Level by the end of the school year; only 67% of these students remained at Grade Level status. The difference between performance and expectation is 23%. • Problem Definition is recorded on the Action Plan for Targeted Group.