Download
1 / 23
230 likes | 359 Vues
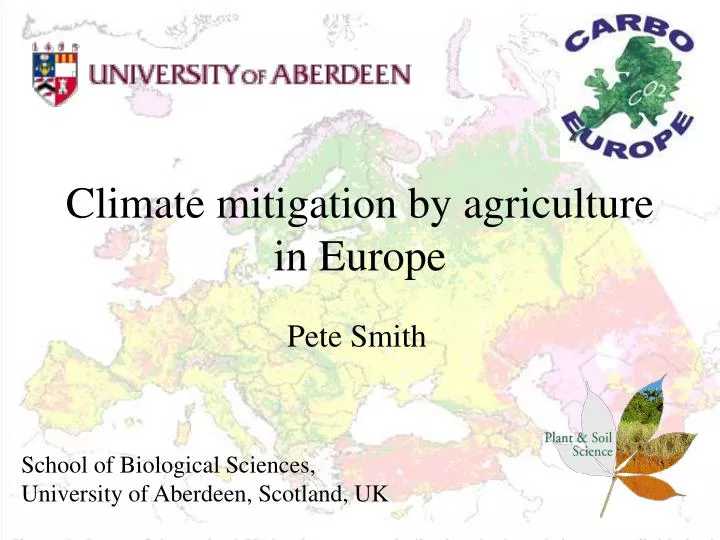
Climate mitigation by agriculture in Europe. Pete Smith. School of Biological Sciences, University of Aberdeen, Scotland, UK. Distribution of croplands globally. Distribution of croplands in Europe. Why croplands?.

E N D
Climate mitigation by agriculture in Europe Pete Smith School of Biological Sciences, University of Aberdeen, Scotland, UK
Why croplands? • European croplands (for Europe as far east as the Urals) lose 300 Mt C y-1 (Janssens et al., 2003) • Mean figure for the European Union estimated to be 78 (SD: 37) Mt C y-1(Vleeshouwers & Verhagen, 2002) • Largest biospheric source of carbon lost to the atmosphere in Europe each year • Highest uncertainty of all European fluxes • There is significant potential to decrease the flux of carbon to the atmosphere from cropland, and for cropland management to sequester soil carbon.
) -1 600 A land signal 400 European terrestrial C balance (Tg C a) B 290 290 C ? 240 220 200 D 135 111 missing fluxes 0 atmospheric signal Carbon balance estimates Croplands in the overall carbon balance of Europe Cropland flux Main figure from Janssenset al., Science 2003
Why croplands? • European croplands (for Europe as far east as the Urals) lose 300 Mt C y-1 (Janssens et al., 2003) • Mean figure for the European Union estimated to be 78 (SD: 37) Mt C y-1(Vleeshouwers & Verhagen, 2002) • Largest biospheric source of carbon lost to the atmosphere in Europe each year • Highest uncertainty of all European fluxes • There is significant potential to decrease the flux of carbon to the atmosphere from cropland, and for cropland management to sequester soil carbon.
Carbon fluxes in SOC in Europe (t C ha-1 y-1) in the 1st commitment period (business as usual scenario) Using mean soil organic carbon content minus S.D. Using mean soil organic carbon content Using mean soil organic carbon content plus S.D. Vleeshouwers & Verhagen (2002) Croplands Grasslands
Why croplands? • European croplands (for Europe as far east as the Urals) lose 300 Mt C y-1 (Janssens et al., 2003) • Mean figure for the European Union estimated to be 78 (SD: 37) Mt C y-1(Vleeshouwers & Verhagen, 2002) • Largest biospheric source of carbon lost to the atmosphere in Europe each year • Highest uncertainty of all European fluxes • There is significant potential to decrease the flux of carbon to the atmosphere from cropland, and for cropland management to sequester soil carbon.
Options for combating the greenhouse effect on European agricultural land • More efficient use of animal manure • Application of sewage sludge • Return surplus cereal straw to the soil • Convert to no-till agriculture • Use surplus arable land to de-intensify production (extensification) • Use surplus arable land to plant woodland • Use surplus arable land to grow biofuels Smith et al. (2000)
C sequestration potential over 1st commitment period Activityt C ha-1 yr-1 Mt C yr-1 Conversion arable to grassland 1.92 178.49 Zero till 0.29 26.69 Straw 0.21 19.85 Farmyard manure (10 ton ha-1) 1.47 136.38 CO20.01 0.94 Temperature -0.06 -5.80 Vleeshouwers & Verhagen (2002)
6 70 5 60 50 4 40 - 3 Maximum Yearly C Mitigation Potential (Tg C y-1) % Offset of 1990 European CO2 carbon emissions 30 2 20 1 10 0 0 Manure Sludge Straw No-till Woodland Bioenergy Extensification Land Management Change Carbon mitigation potential / CO2-C offsets Smith et al. (2000)
Combined land-management options Europe’s 8% Kyoto target 9 110 100 8 90 7 80 6 70 5 60 Maximum Yearly C Mitigation Potential (Tg C y-1) % Offset of 1990 European CO2 carbon emissions 50 4 40 3 30 2 20 1 10 0 0 Opt E+S B+S B+O E+O W+S E+NT W+O B+NT W+NT B+O+NT E+O+NT W+O+NT Scenario Smith et al. (2000)
What is meant by C sequestration potential ? Maximum value Minimum value Carbon sequestration potential Biological potential Economically constrained potential Socially / politically constrained potential - estimated realistically achievable potential (~10% of biological potential) Biologically / physically constrained potential (e.g. land suitability) EU-15 can sequester up to 16-19 Mt C y-1 during the first commitment < 1/5 of theoretical potential ~ 2% of European anthropogenic emissions (Freibauer et al., 2004). Smith (2004)
Carbon sequestration potential (EU-15 cropland) 1 = Vleeshouwers & Verhagen (2002) 2 = Smith et al. (1997, 2000) 3 = Freibauer et al. (2004) 4 = Smith et al. (2004)
The energy / emission gap under different SRES scenarios Why use C sequestration? • Current yearly atmospheric C increase = 3.2 ± 0.1 Pg C y-1 • Maximum yearly global C sequestration potential = 0.9 ± 0.3 Pg C y-1 • Emission gaps here of up to 25 Pg C y-1 by 2100 IPCC TAR WGIII (2001)
Critical period determining trajectory So why use C sequestration? IPCC (2001)
6 70 = CO2-C alone = CO2-C plus N2O and CH4 = CO2 only = with trace gases 5 60 Some land-management practices are influenced by including trace gases 50 4 40 Maximum Yearly C Mitigation Potential (Tg C y-1) 3 % Offset of 1990 European CO2 Emissions 30 2 20 1 10 0 0 Straw Extensification Woodland Bioenergy Manure Sludge No-till Land Management Change C mitigation potential with and without trace gases Smith et al. (2001)
Land-use change – potential size of effect SRES climate only SRES-B2 plus convert grassland to arable in 2000 Loss (2001-2100) of 37.7 t C ha-1 compared to B2 loss of 9.5 t C ha-1 due to climate change alone
Research Priority Areas • Soil process studies in agriculture • Data / inventory collation and meta-analysis • Development of future land-use and land management scenarios • Coupling of the C & N cycles (with N-IP) • Assessment of total GHG budget (with N-IP) • Mitigation options Overall aim: Quantify the carbon and GHG balance of European croplands for the 1990s, for the present, and in the future