Download
1 / 28
300 likes | 992 Vues
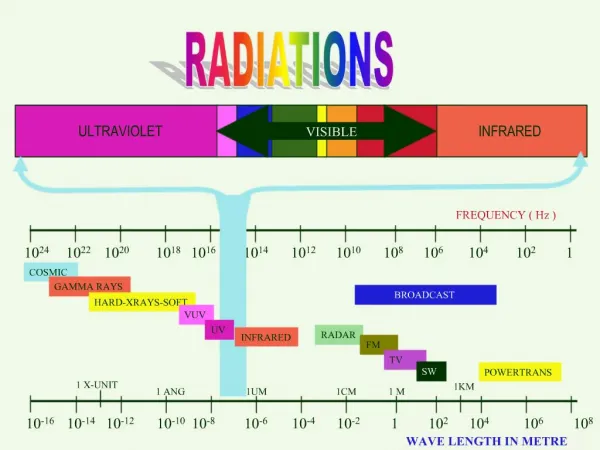
Infrared. The most useful part of the infrared spectrum for the detection and determination of organic species is from 2.5 to 15 m in wavelength which corresponds to a wavenumber range of 4000 to 667 cm -1 . Fingerprints Structural Information. Infrared.

E N D
Infrared • The most useful part of the infrared spectrum for the detection and determination of organic species is from 2.5 to 15 m in wavelength which corresponds to a wavenumber range of 4000 to 667 cm-1. • Fingerprints • Structural Information
Infrared • Chemists tend to use wavenumbers not wavelengths. • Wavenumbers are directly proportional to energy. • A higher wavenumber corresponds to a higher energy.
Infrared • Infrared Absorption • Molecules excited to a higher energy state • A quantised process • A molecule only absorbs selected frequencies • Corresponds to energy changes of the order 8-40 kJ/mole
Infrared • Infrared Absorption • The absorbed energy corresponds to the VIBRATIONAL frequencies of the molecule. • Not all bonds in a molecule are capable of absorbing infrared energy. • Only those bonds which contain a DIPOLE MOMENT. • A bond must therefore present an electrical dipole which is changing as a function of time at the same frequency as the incoming radiation.
Infrared • Vibrational Modes • Many vibrational modes • Simplest types • Stretching • Bending
Infrared • Bond Properties • A diatomic molecule can be considered as two vibrating masses connected by a spring. • The bond distance continually changes but an equilibrium or average bond distance can be defined. • This behaviour is described as harmonic oscillation. • The natural frequency of vibration of a bond is derived from Hooke’s law for vibrating springs.
Infrared • Bond Properties • The total amount of energy is proportional to the frequency of the vibration and for a harmonic oscillator is determined by the force constant (K) of the spring and the masses m1 and m2 of the two bonded atoms. • The reduced mass, of the system is given by: = m1m2 / m1 + m2
Infrared • Stronger bonds have a larger force constant and vibrate at higher frequencies.
Infrared • Bonds between atoms of higher masses vibrate at lower frequencies.
Infrared • Instrumentation • Dispersive Spectrometers • Fourier Transform Spectrometers • Sample Preparation • Correlation Charts and Tables
Spectrum Analysis • The method of spectral analysis is dependent upon the information you have available. • General Rules • Identification of Functional Groups • Molecular Formulae and Hydrogen Deficiency • Full Spectral Interpretation
Spectrum Analysis • How to approach the analysis of an infrared spectrum. • Or - what you can tell at a glance! • Looking for functional groups.
Spectrum Analysis • Look for a few major functional groups - C==O, OH, NH, C==C and C==C - which are conspicuous. • Do not try to make a detailed analysis of the CH absorptions near 3000cm-1. • DO NOT WORRY ABOUT SUBTLETIES.
Spectrum Analysis 1. Is a carbonyl group present? A strong absorption in the region 1820-1660 cm-1 Often the strongest in the spectrum. You can’t miss it! 2. If a carbonyl is present check the following types, if it is absent go to 3.
Spectrum Analysis ACIDS: is OH also present? broad absorption near 3400-2400 cm-1. AMIDES: is NH also present? medium absorption near 3400 cm-1. ESTERS: is C--O also present? strong intensity absorption near 1300- 1000 cm-1.
Spectrum Analysis ANHYDRIDES:two C==O near 1810 and 1760 cm-1. ALDEHYDES: is aldehyde C--H present? two weak absorptions near 2850 and 2750 cm-1. KETONES: the proceeding five choices have been eliminated.
Spectrum Analysis 3. If carbonyl absent then check: Alcohols and phenols broad absorption near 3400-2400 cm-1 and strong intensity absorption near 1300-1000 cm-1. Amines medium absorption near 3400 cm-1. Ethers strong intensity absorption near 1300-1000 cm-1.
Spectrum Analysis 4. Double Bonds A weak absorption near 1650 cm-1. 5. Triple Bonds A weak, sharp absorption near 2150 cm-1. 6.Hydrocarbons None of the preceeding found Major absorptions in CH region near 3000 cm-1.
Spectrum Analysis • RESIST THE IDEA OF TRYING TO INTERPRET EVERY PEAK. IT IS NOT POSSIBLE!
Spectrum Analysis • Molecular Formulae • Derived from Empirical Formulae • Ethane • Empirical formula CH3 • Molecular mass 30 • Molecular formula CH3CH3
Spectrum Analysis • The Index of Hydrogen Deficiency • The number of bonds or rings a molecule contains. • From a comparison of the molecular formula and that of a corresponding acyclic saturated compound. • The difference in numbers of hydrogens between these formulae divided by two gives the index of hydrogen deficiency.
Spectrum Analysis • Hydrogen Deficiency • Alkane: CnH2n+2 • Alkene or cycloalkane: CnH2n • Alkyne: CnH2n-2 • Hydrogen Deficiency • N, P, As, etc: +1 • O, S, Se, Te: no change • Halides: -1
Spectrum Analysis • The Index of Hydrogen Deficiency • One - a double bond or a ring but not both. • Two - a triple bond, 2 double bonds, two rings or a combination of both. • Four - a ring and three double bonds for example benzene.
Spectrum Analysis • Other examples • Chloral Hydrate • Nicotine
Spectrum Analysis • How to approach the analysis of an infrared spectrum. • A more detailed look.