Download
1 / 17
170 likes | 308 Vues
Gender Differences. Deb Hoskins Chair, Dept. of Women’s, Gender, and Sexuality Studies, and Inclusive Excellence Coordinator, Center for Advancing Teaching and Learning, UW-L. "Findings" vs. Stereotypes. Contingency: change with new evidence

E N D
Gender Differences Deb Hoskins Chair, Dept. of Women’s, Gender, and Sexuality Studies, and Inclusive Excellence Coordinator, Center for Advancing Teaching and Learning, UW-L
"Findings" vs. Stereotypes • Contingency: change with new evidence • Inter-group heterogeneity: average means the group varies • Clue: may or may not apply to any particular individual
"Findings" • Generalizations based in scientific analysis (e.g., "means" or averages) • Different from chance ("statistically significant") • Consistent measure ("reliability') • Measures what it purports to measure ("validity") • Degree of difference between means ("effect sizes") matter
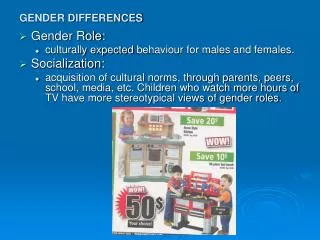
Which gender differences matter? • One cognitive difference (sorta) • Students' fears of enacting a stereotype • Manifestation of psychological disorders • Pressures on students from sociocultural gender messages • Implicit assumptions of authority figures
Which differences don’t? • “Learning styles" • Don’t exist • Teaching to it doesn’t help • Vast majority of cognitive skills • Only one consistently shows gender differences
Spatial rotation skills • Many boys will also be at risk • Differences can be overcome with learning • Knowing where a problem lies can tell us where to teach • Math is a SKILL
"Stereotype threat" This is an important test! If I don’t do well, guess what people will think about girls? And about BLACK girls? They’ll think ALL of us are dumb! • Underperformance when a negative stereotype is active • Distracted thinking • Positive images help • EVERYONE can learn
Psychological disorders • Boys may present with more disruptive behaviors • Girls may go unnoticed • Boys may get more latitude • Race matters
Gender pressures Race Matters
Heightened risks • For girls: • Ostracism, exclusion • Sexual harassment and assault • Body image problems and disordered eating • Depression/anxiety disorders, substance abuse • For boys: • Bullied, esp. over perceived sexual orientation • Substance abuse and depression • Violence
Our subconscious assumptions • “Implicit assumptions”: stereotypes operate subconsciously • Sugar/frogs, spice/snails . . . • Who loves tests? You know you do! Implicit Assumption Tests at Harvard
What you can do • Build relationships with students • Emphasize effort and thinking, not smartness • Include a diverse range of women • Intervene in abusive interactions • Avoid activating stereotypes
Learn to see it • Trusted observer • Narrow the focus • Separate description from judgment (this takes practice) • Observe multiple days • Use a data collection form: a seating chart offers a good beginning
Volunteers vs. non-volunteers • Use a table for your seating chart • Record sex and race of each student on the chart • V = teacher interacted, student volunteered • N = teacher interacted, student did not volunteer • Record nothing for no interaction
Volunteers vs. non-volunteers • Calculate the % of the total class in each group • Girls = 13/24 (54%) • Boys = 11/24 (46%) • Calculate the % of interactions by group • Girls = 19/83 (29%) • Boys = 64/83 (77%) • Repeat by race • Examine V and N by sex and race