Download
1 / 29
320 likes | 479 Vues
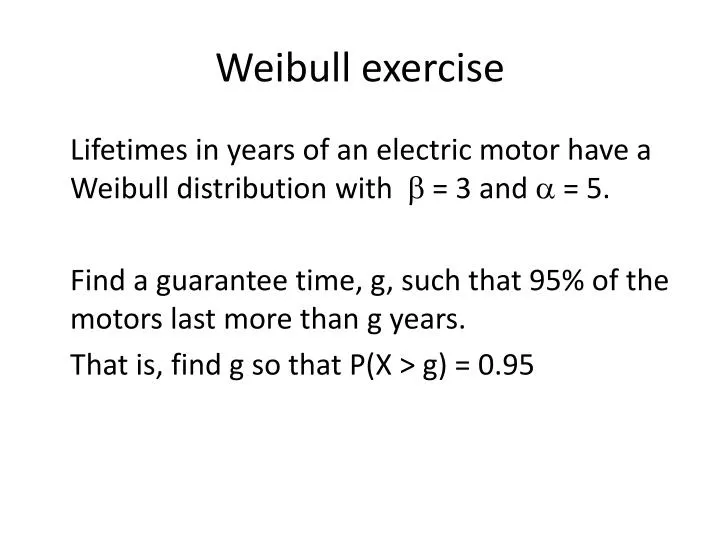
Weibull exercise. Lifetimes in years of an electric motor have a Weibull distribution with b = 3 and a = 5. Find a guarantee time, g, such that 95% of the motors last more than g years. That is, find g so that P(X > g) = 0.95. 5.5.3 Means and Variances for Linear Combinations.

E N D
Weibull exercise Lifetimes in years of an electric motor have a Weibull distribution with b = 3 and a = 5. Find a guarantee time, g, such that 95% of the motors last more than g years. That is, find g so that P(X > g) = 0.95
5.5.3 Means and Variances for Linear Combinations What is called a linear combination of random variables? aX+b, aX+bY+c, etc. 2X+3 5X+9Y+10
If a and b are constants, then E(aX+b)=aE(X)+b. __________________________ • Corollary 1. E(b)=b. • Corollary 2. E(aX)=aE(X).
Suppose that “20 ohm” resistors have a mean of 20 ohms and a standard deviation of 0.2 ohms. Four independent resistors are to be chosen a connected in series. R1 = resistance of resistor 1 R2 = resistance of resistor 2 R3 = resistance of resistor 3 R4 = resistance of resistor 4 The system’s resistance, S, is S = R1 + R2 + R3 + R4 Find the mean and standard deviation for the system resistance, S.
5.5.4 Propagation of Error • Often done in chemistry or physics labs. • In last section we talked about the case when U=g(x) is linear in x
When U=g(X,Y,…Z) is not linear • We can get useful approximations to the mean and variance of U. • Using Taylor expansion of a nonlinear g, Where the partial derivatives are evaluated at (x,y,…,z)=(EX, EY,…,EZ).
For the mean E(U) since
Example 24 on page 311 The assembly resistance R is related to R1, R2 and R3 by A large lot of resistors is manufactured and has a mean resistance of 100 Ω with a standard deviation of 2 Ω. If 3 resistors are taken at random , can you approximate mean and variance for the resulting assembly resistance?
5.5.5 The Central Limit Effect • If X1, X2,…,Xnare independent random variables with mean m and variance s2, then for large n, the variable is approximately normally distributed.
If a population has the N(m,s) distribution, then the sample mean x of n independent observations has the distribution. For ANY population with mean m and standard deviation s the sample mean of a random sample of size n is approximately when n is LARGE.
Central Limit Theorem If the population is normal or sample size is large, mean follows a normal distribution and follows a standard normal distribution.
The closer x’s distribution is to a normal distribution, the smaller n can be and have the sample mean nearly normal. • If x is normal, then the sample mean is normal for any n, even n=1.
Usually n=30 is big enough so that the sample mean is approximately normal unless the distribution of x is very asymmetrical. • If x is not normal, there are often better procedures than using a normal approximation, but we won’t study those options.
Even if the underlying distribution is not normal, probabilities involving means can be approximated with the normal table. • HOWEVER, if transformation, e.g. , makes the distribution more normal or if another distribution, e.g. Weibull, fits better, then relying on the Central Limit Theorem, a normal approximation is less precise. We will do a better job if we use the more precise method.
Example • X=ball bearing diameter • X is normal distributed with m=1.0cm and s=0.02cm • =mean diameter of n=25 • Find out what is the probability that will be off by less than 0.01 from the true population mean.
Exercise The mean of a random sample of size n=100 is going to be used to estimate the mean daily milk production of a very large herd of dairy cows. Given that the standard deviation of the population to be sampled is s=3.6 quarts, what can we assert about the probabilities that the error of this estimate will be more then 0.72 quart?


![[Exercise Name] Functional Exercise](https://cdn0.slideserve.com/621913/exercise-name-functional-exercise-dt.jpg)
![[Exercise Name] Functional Exercise](https://cdn1.slideserve.com/1717560/exercise-name-functional-exercise-dt.jpg)


![[Exercise Name] Functional Exercise](https://cdn3.slideserve.com/6680259/exercise-name-functional-exercise-dt.jpg)
![[Exercise Name] Tabletop Exercise](https://cdn4.slideserve.com/9191716/exercise-name-tabletop-exercise-dt.jpg)