Download
1 / 21
210 likes | 355 Vues
The role of increasing temperature variability in European summer heat waves. Christoph Schär, Pier Luigi Vidale, Daniel Lüthi, Christoph Frei, Christian Häberli, Mark A. Liniger & Christof Appenzeller. Overview. Luterbach et al: European temperature trends and extremes since 1500

E N D
The role of increasing temperature variability in European summer heat waves Christoph Schär, Pier Luigi Vidale, Daniel Lüthi, Christoph Frei, Christian Häberli, Mark A. Liniger& Christof Appenzeller
Overview • Luterbach et al: European temperature trends and extremes since 1500 • Summer 2003 data • Schär et al: Increasing temperature variability in European heatwaves Literaturseminar 30. April, 2004
Luterbacher et al: European mean temperature since 1500 Winter • warmest winter: 1989/90 T = +2.4°C • warmest decade: 1989-98 T = +1.2°C • (second warmest 1733-42 T = +0.45°C) • linerar temperature trend for 20th century: • +0.08°C 0.07°C per dec. Literaturseminar 30. April, 2004
Luterbacher et al: European mean temperature since 1500 Summer • warmest summer: 2003 T = +2.0°C • warmest decade: 1994-03 T +1.2°C • conspicuous: warming trends of up to 0.7°C 0.20°C per decade can be observed 1731-57, 1923-47, and 1994-2003 Literaturseminar 30. April, 2004
Luterbach et al: European mean temperature since 1500 Literaturseminar 30. April, 2004
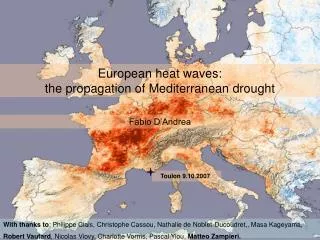
Summer 2003 Data • Warmest summer in the last 500 years in Europe (June, July, August) • Sub tropic high pressure belt shifted north over southwestern Europe Warm air masses pushed north • Unusually small amounts of precipitation during spring and summer months Literaturseminar 30. April, 2004
Temperature anomalysummer 2003 Literaturseminar 30. April, 2004
Deviation from the avg temp (1876-2000) in Karlsruhe Literaturseminar 30. April, 2004
Satellite views Satellitenbild, 8.8.2003, 12:09 UTC, NOAA 16, VISQuelle: Inst. f. Meteorologie, FU Berlin Satellitenbild, 8.8.2003, 18:00 UTC, MET 7, IR Quelle: Fak. f. Ingenieurwissenschaften, Univ. Ulm Literaturseminar 30. April, 2004
Summary: 2003 data Literaturseminar 30. April, 2004
Summary: 2003 data Comparison to 1876-2000 avg Literaturseminar 30. April, 2004
Schär et al: European temperature anomaly Literaturseminar 30. April, 2004
Distribution of Swiss monthly temperatures 1864-2003 Literaturseminar 30. April, 2004
Monthly Temp anomalies (J-D) 1864-1923 & 1941-2000 Literaturseminar 30. April, 2004
Relative frequency change between the two periods Literaturseminar 30. April, 2004
Estimation of return period • Reference period = 1864-2000 return period several million years • Accounting for warming: Reference period = 1990-2002 return period = 46000 yr. However: large uncertainty 90% confidence interval: = 9000 yr. Literaturseminar 30. April, 2004
Modeling • Regional climate model driven by two general circulation models at the lateral boundaries. Fairly high resolution • Model control period (CRTL) 1961-90 shows good agreement with measured data for northern Switzerland: T(CRTL) = 16.1°C , SD = 0.96°C T(Meas) = 16.9°C , SD = 0.94°C Literaturseminar 30. April, 2004
Modeling: Future scenario (SCEN) 2071-2100 summer Statistical temperature distributions resulting from the RCM driven by a greenhouse-gas scenario Literaturseminar 30. April, 2004
Temperature change and variability according to SCEN Literaturseminar 30. April, 2004
Temperature and precipitation anomalies in n. Switzerland Measurement data 1864-2003 CTRL & SCEN data Literaturseminar 30. April, 2004
Schär et al: Conclusion • A shift of the statistical temperature distribution towards warmer temperatures fails to explain summer 2003 temperatures • Proposal: An increase in variability as well as mean temperature may account for summer 2003 conditions • RCM simulations seem to verify this hypothesis Literaturseminar 30. April, 2004