Download
1 / 26
260 likes | 442 Vues
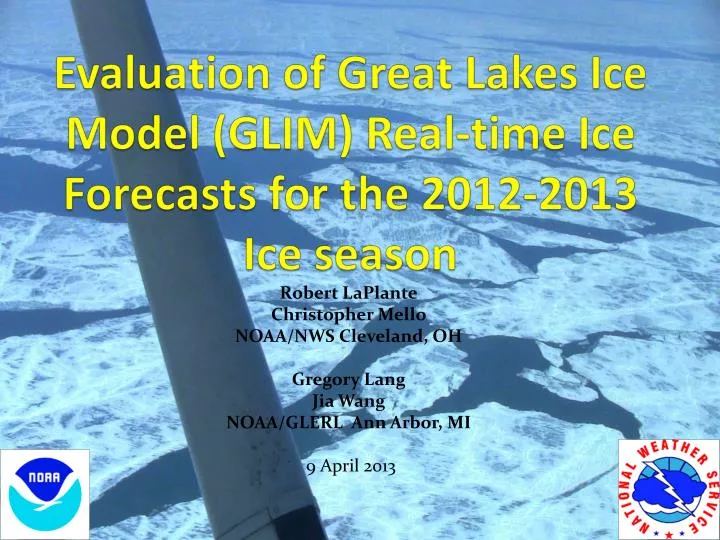
Evaluation of Great Lakes Ice Model (GLIM) Real-time Ice Forecasts for the 2012-2013 Ice season. Robert LaPlante Christopher Mello NOAA/NWS Cleveland, OH Gregory Lang Jia Wang NOAA/GLERL Ann Arbor, MI 9 April 2013. Outline. Description of the GLIM

E N D
Evaluation of Great Lakes Ice Model (GLIM) Real-time Ice Forecasts for the 2012-2013 Ice season Robert LaPlante Christopher Mello NOAA/NWS Cleveland, OH Gregory Lang Jia Wang NOAA/GLERL Ann Arbor, MI 9 April 2013
Outline • Description of the GLIM • Comparison of the GLIM to the National Ice Center analysis for the 2012-2013 ice season • Addition of Vessel Icing parameter • Future plans for the GLIM MODIS 4-9 March 2010
Description of the GLIM • GLIM has been under development by GLERL since 2007 • GLIM is a combination of the Princeton Ocean Model for hydrodynamics and the Combined Ice Ocean Model tailored for the Great Lakes • GLIM which has two modules, runs twice a day for all five Great Lakes as part of the Great Lakes Coastal Forecast system (GLCFS) at NOAA/GLERL • Hourly Nowcast runs - ingest surface meteorological and daily NIC ice concentration observations • Forecast runs from 00 to 12o hours – driven by the NDFD • The GLIM is run using the latest surface forecast meteorological grids from the NWS National Digital Forecast Database (NDFD) out to 5 days
GLIM resolution for the Great Lakes 10 km 2 km 5 km 2km 2km
Description of the GLIM • GLIM Nowcasts of ice concentration are “nudged” towards the daily NIC ice concentration field and form the initial conditions for the forecast module • Model output for the GLIM is posted to the web • NWS CLE retrieves via ftp the GLIM for AWIPS and GFE
GLIM Ice Concentration is nudged toward the NIC ice concentration field which is updated daily GLIM NIC
GLERL GLIM included in the GLCFSGreat Lakes Coastal Forecasting System http://www.glerl.noaa.gov/res/glcfs/ Select “Ice”
Integration of the GLIM and NDFD results in the Forecast Generation of: Surface Water Temperature Ice Concentration Ice Thickness Ice Drift & Vessel Icing http://www.glerl.noaa.gov/res/glcfs/glcfs-ice.php?lake=e&type=N&hr=00
Sources of Error in the GLIM Ice Concentration Forecast • Error in the daily NIC ice concentration analysis • NIC analysis data sources are lagged: ~00 and ~12 UTC RADARSAT passes & previous day ~18 UTC MODIS imagery and current day ~18 UTC MODIS imagery are combined and posted about 00 UTC the next day • Variable observation times add uncertainty due to advective changes and growth and decay of ice cover • Subjectivity of the ice analyst in specifying ice edge and concentration • Error in the NDFD parameters (wind, temperature, or dewpoint) over the entire Great Lakes • Error within the GLIM: nudging procedure, vertical mixing, or wave mixing
Winter Temperatures • While still above normal, the 2012-13 winter was colder than the unseasonably mild 2011-2012 winter • Resultant Great Lakes ice cover increased, especially on shallow Lake Erie • Maximum seasonal ice cover attained by lake (GLERL) 2011-2012 2012-2013 • Lake Ontario 3% 15% • Lake Superior 7% 38% • Lake Erie 16% 85% • Lake Michigan 17% 20% • Lake Huron 20% 40%
Assessment of the NIC Ice Analysis NIC ice analysis was not Realistic at times with ice Concentration decreasing With air temperatures Below freezing Temperature
Assessment of the NIC Ice Analysis NIC Analysis exhibited Occasional spikes of increased Ice concentration which lasted But a day or so and were not Realistic. In particular, we Will examine the second, or Day 62 spike on Lake Superior When the ice cover nearly doubled For only a day Lake Superior
Assessment of the NIC Ice Analysis Day61 Ice Concentration Day62 Note the abrupt increase and decrease in ice concentration From Day61 through Day63 over Western Lake Superior Day63
This High Nowcast, due to the high NIC analysis, produced a high starting forecast Which, with low air temperatures Leads to these high 1-day, 3-day, and 5-day forecasts
Change in GLIM forecast Ice Concentration vs Change in NIC ice analysis Lake Superior NIC spikes are apparent in these x/y plots of the GLIM days 1-3-5 forecasts
Lake Erie To fast Ice growth Too slow ice growth in GLIM Too slow melt Too fast melt GLIM tends to Grow or melt Ice too slowly in Day 3 and Day 5 forecasts
Summary of the GLERL GLIM2012-2013 ice season on Lake Erie • GLIM was successfully run over all the Great Lakes • GLIM nowcasts for 2012-2013 closely matched the NIC ice concentration analysis with daily nudging across all the lakes • Since the NIC analysis is not a snap shot of the observed ice cover…some uncertainty is introduced into the GLIM • “Spikes” in the daily NIC ice analysis appeared spurious • Compared to NIC analysis, the GLIM 3-day and 5-day forecasts tended to grow and melt ice too slowly on all the Lakes • Difficult to separate error in NIC analysis and NDFD with error in GLIM
Prediction of Vessel Spray Icing with the Great Lake Ice Model
Sea Spray Icing Algorithm • In the past we used Nomograms of Icing for Various water temperatures:
Sea Spray Icing Algorithm • Using the work of Overland et al. (1986) & (1990): Icing Predictor: PPR is defined by GLERL modified the equation for fresh water and used output from the Great Lakes Ice Mode (GLIM) to produce icing classes for all five lakes
Icing Classes • Icing classes are determined with the assumption that vessels are steaming into the wind and of 20 -75 meters in length
Vessel Icing over Lake Erie NIC 31 Jan 2013 White area is where Ice has formed
Potential Issues • Shoreline affects are not accounted for in icing potential • For a given wind, waves and resultant freezing spray will be less at the start of the fetch • The reduction in freezing spray due to lake ice cover has not been determined, but at some high percentage of ice cover (>70%), freezing spray may be minimal
Vessel Icing Notes • GLERL added the Vessel Icing parameter to its web site http://www.glerl.noaa.gov/res/glcfs/ • The quality of the freezing spray forecast is dependent on the inputs into the GLIM which include the NDFD • Surface Wind • Air Temperature • So pay attention (American Forecasters) to the NDFD grids over the entire lake you forecast for
Future Plans for the GLIM • GLCFS POM (currently running the GLIM) will not be modified • GLERL is in the process of developing a new model: an operational FVCOM (Finite Volume Coastal Ocean Model) for Lake Erie • Variable grid and much higher resolution for harbors and bays • Heat fluxes are being calculated and testing of ice dynamics is expected over the next year • Plan to test the Lake Erie FVCOM this fall at CSDL (Coastal Survey Development Lab) • By late summer 2014, FVCOM may be delivered to NCEP • Remaining lakes will be modeled by early 2017
Questions ? Robert.laplante@noaa.gov