Download
1 / 32
320 likes | 499 Vues
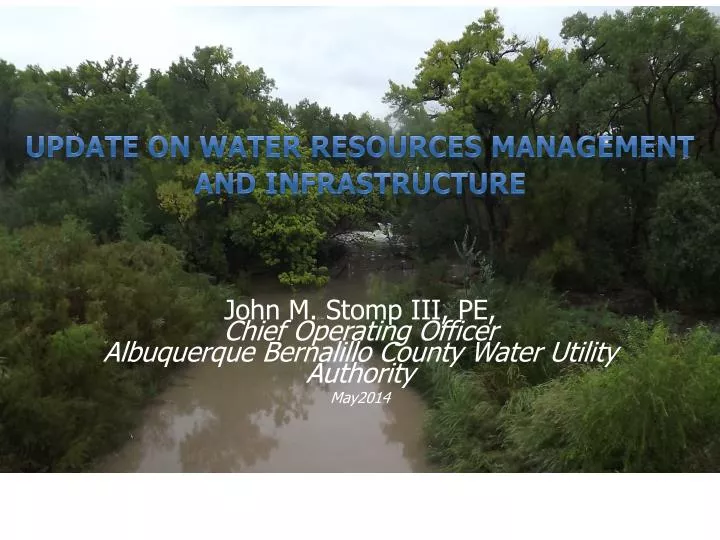
UPDATE on water resources management and infrastructure . John M. Stomp III, PE, Chief Operating Officer Albuquerque Bernalillo County Water Utility Authority May2014. Rio Grande. Water Table. Wells. Aquifer. Background: Ground and surface water resources.

E N D
UPDATE on water resources management and infrastructure John M. Stomp III, PE,Chief Operating OfficerAlbuquerque Bernalillo County Water Utility Authority May2014
Rio Grande Water Table Wells Aquifer Background: Ground and surface water resources • Aquifer can no longer sustainably supply water at needed levels • Additional sources and management are required San Juan-Chama
Albuquerque Ground-Water Levels Show Huge Declines Pumping Cone of Depression in 2002
Water Authority’s 2007 Water Resources Management Strategy • Conservation • Reuse for industry and irrigation • Use of surface water (Colorado San Juan-Chama trans-basin diversion to Rio Grande) • Aquifer storage and recovery (related to surface water treatment) • New Supplies
300,000 Renewable 200,000 Recycling Conservation New sources Water Demand (acre-feet/year) Non-Renewable 100,000 ~100KAFY Surface Water Owned by Water Authority Aquifer Drawdown ~50KAFY Renewable Groundwater 0 2000 2020 2040 2060 1960 1980 Year Water Authority’s water resource management strategy includes:
Comparison of Water Conservation Programs – Colorado River Users • Water Authority – 136 gpcd • Salt Lake City area – 244 gpcd • Tucson – 131 gpcd • Phoenix – 251 gpcd • Las Vegas – 251 gpcd • Los Angeles – 152 gpcd
SJC DWP Restricted Diversions During Drought Remaining Ground Water Use Drought Minimum Ground Water Use
Drinking Water Project Operations • 2008 – 367 (1%) • 2009 – 21,357 (21%) • 2010 – 42,803 (40%) • 2011 – 41,281 (40%) • 2012 – 43,208 (41%) • 2013 – 39,929 (42%) • 2014 – 40,000 (?)
Groundwater Storage and Water Levels - Recent trends with DWP
What is happening to the aquifer? DWP Online
Future Reduced Depletions and Available Return Flows • More return flow is expected to be available in the future for other uses
ASR Projects • Bear Canyon Arroyo ASR Project • Completed two seasons of pilot testing • Application for full scale permit to be submitted in March 2014 • Large Scale ASR • Direct injection • Existing Wells – high arsenic • In design and testing phase
Water Authority’s Next Water Resources Management Strategy • Public Process – alternative development • Fall 2014 – Fall 2015 • Conservation – new goal? • Additional Reuse – indirect/direct potable • Diversion of native water rights • Aquifer storage and recovery (related to surface water treatment) • New Supplies
Overall Satisfaction with the Services Provided by the Water Authority 94% of customers are satisfied
Water Rates Should Be Increased to Cover the True Costs to Treat and Deliver Water to Our Homes and Businesses 64% of customers agree
Investing in the Repair and Replacement ofOld Water & Sewer Lines 88% of customers feel it is important
Condition of Water Lines The majority (57%) of residential customers express satisfaction. However, only 18% are very satisfied and over one-quarter (29%) report dissatisfaction with the condition of water lines.
Condition of Sewer Lines The majority (60%) of residential customers report satisfaction regarding the condition of sewer lines, though 17% say they are dissatisfied.
Water and Wastewater Service Charges- Residential 5/8” Meter
Finance Plan Summary in thousands
Increase CIP Spending in thousands
Asset Management Program defines needed CIP renewal spending
Revenue shortfall will delay ramp-up in Renewal Program spending