Download
1 / 10
100 likes | 209 Vues
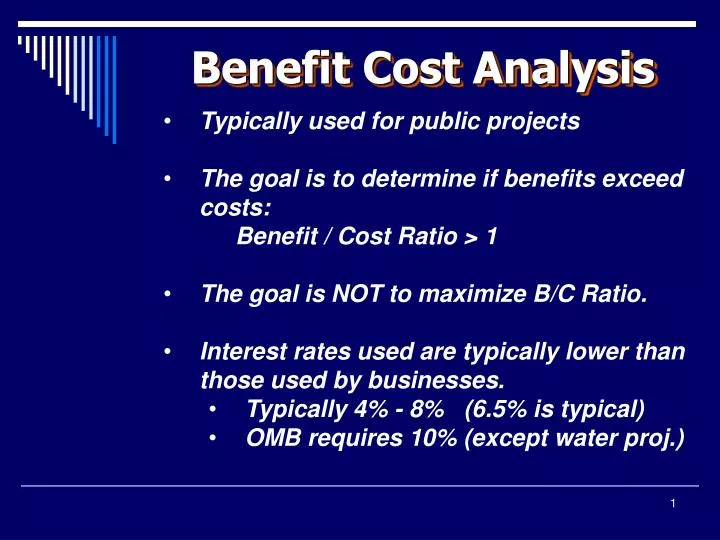
Benefit Cost Analysis. Typically used for public projects The goal is to determine if benefits exceed costs: Benefit / Cost Ratio > 1 The goal is NOT to maximize B/C Ratio. Interest rates used are typically lower than those used by businesses. Typically 4% - 8% (6.5% is typical)

E N D
Benefit Cost Analysis • Typically used for public projects • The goal is to determine if benefits exceed costs: • Benefit / Cost Ratio > 1 • The goal is NOT to maximize B/C Ratio. • Interest rates used are typically lower than those used by businesses. • Typically 4% - 8% (6.5% is typical) • OMB requires 10% (except water proj.)
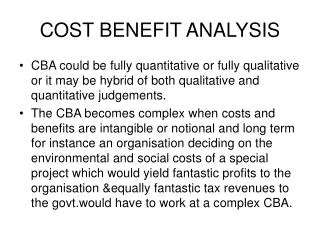
Benefit Cost Analysis The challenge is to quantify the benefits and costs. The equation… B/C = (Benefits – Disbenefits) to the public (Costs) to sponsoring agency You can use NPW, EAW, even NFW – whichever is easier in a particular problem.
Benefit Cost Analysis • Steps: • Define the planning horizon. • Specify the Discount Rate (MARR) to be used. • Develop the cost and benefit-disbenefit profiles in monetary terms. • Compare the benefits to costs using a specified measure of worth, such as annual equivalent or present worth. • If the B/C ratio is: • > 1 project is justified • = 1 barely justified – political • < 1 not justified • 6. Repeat steps 3 – 5 for alternative viewpoints
Example A city library is to be expanded to include meeting rooms, more electronic volumes, computer facilities, and electronic check-in and check-out. The cost of the expansion will be $700,000 and the new equipment will cost another $175,000. Maintenance and renewal of the new addition and equipment will run approximately $100,000/year. The library is projected to be in operation for 20 years, with a residual value of 40% of first cost for the physical facilities. There is no salvage value for the equipment. Discount is 8%. An estimated 150,000 people will visit the library each year. How much additional benefit per person, per year, must the library visitors perceive in order to justify the expansion?
Perspective Matters Suppose the library charged an annual fee Suppose the entire county sponsored The equation… B/C = (Benefits – Disbenefits) to public (Initial Investment) by sponsor What is the viewpoint of a user? What is the viewpoint of a non-user?
Incremental B/C Analysis MUST be used when there are multiple alternatives to choose from! The equation is still… B/C = (Benefits – Disbenefits) to the public (Costs) to sponsoring agency You can use Incr. NPW or Incr. EAW – whichever is easier in a particular problem.
Incremental B/C Analysis • Steps: • Define the set of feasible, mutually exclusive, public sector alternatives to be compared. • Define the planning horizon. • Develop the cost and benefit-disbenefit profiles in monetary terms for each alternative. • Specify the MARR to be used. • Order the alternatives from smallest to largest Cost • Compare the alternatives using a specified measure of worth, such as annual equivalent, capitalized cost, or present worth (with matching lifetimes). If the B/C ratio is: • > 1 higher cost project is justified • ≤ 1 lower cost project is still justified
B – D C (136 – 89) – (10 – 14) = 51 = 2.55 (70 – 50) 20 Upgrade to E Upgrade to G Upgrade to A Keep Proj. E (136 – 136) – (10 – 10) = 0 = 0 (90 – 70) 20 (174 – 136) – (4 – 10) = 44 = 1.47 (100 – 70) 30 Incremental Benefit Cost Analysis Example Not Feasible 1.7 1.0 1.4 0.9 1.8 1.6 1.5 Cost Order: G E C A F B G – DN: (From feasibility, (B – D) / C = 1.5 E – G: C – E: A – E:
(178 – 174) – (2 – 4) = 6 = 0.6 (110 – 100) 10 Best is Proj A (180 – 174) – (60 – 4) = – 50 = – 2.5 (120 – 100) 20 Incremental Benefit Cost Analysis Example Not Feasible B – D C 1.7 1.0 1.4 0.9 1.8 1.6 1.5 Cost Order: G E C A F B F – A: Keep Proj. A B – A:
Bonus Problem: B/C Build-Up Example Snack Fridge Viability Data: 110 IE & EngM students 48% will use snack fridge instead of going home Users average (2) drinks & (1) snack each week Mark-up is 10%, drink price is $.50, snacks $.75 School year averages 32 weeks Fridge costs $495, lasts 8 yrs, 8% cpd annually If they save time & $$ on snacks & drinks, they can buy books , study more, and expect one of them to win a$5 500 national scholarship every 4 years.But the vending company will quit donating $300 per year to their Tech Society Perform a B/C analysis – IE student perspective