Download
1 / 21
250 likes | 500 Vues
Potential Future Land Loss of Small Islands of Puerto Rico and the United States Virgin Islands. David M. Bush William J. Neal Pablo Llerandi-Román Chester W. Jackson, Jr. Tasks. Coastal Recession Slope/retreat (Bruun Rule) Extrapolation of historical shoreline change

E N D
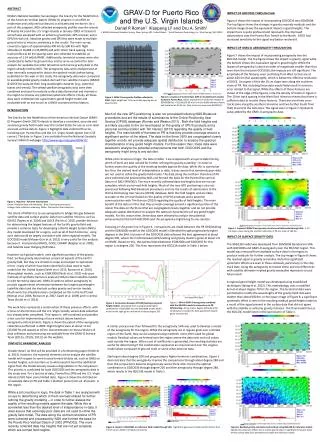
Potential Future Land Loss of Small Islands of Puerto Rico and the United States Virgin Islands David M. Bush William J. Neal Pablo Llerandi-Román Chester W. Jackson, Jr.
Tasks • Coastal Recession • Slope/retreat (Bruun Rule) • Extrapolation of historical shoreline change • Coastal Vulnerability Index • Detailed surface mapping with Lidar • Outreach • Geoindicator assessments • Workshop (held July 2011)
MODIFICATION OF Coastal Vulnerability Index (CVI) The above parameters are utilized in the analysis of mid-Atlantic barrier islands (Pendleton et. al, 2004). For Puerto Rico, different controls influence the stability and configuration of the shoreline (such as differences in wave, wind, and storm activity). Upon completion of detailed field mapping, a revised version of the CVI will be proposed which incorporates the use of more appropriate coastal variables for hazard assessment in the Caribbean.
Cayo Ratones Arecife Media Luna
Geoindicators • This methodology developed by Bush et. al (1999) provides a quick and efficient hazard assessment tool that can be applied to coastal studies in any stage of progress. • The checklist identifies a basic set of parameters that primarily influence an area’s level of risk as low, moderate, or high based on coastal geology, geomorphology, and engineering. • Parameters range from general (elevation, vegetation, tidal range) to specific (shoreline stability, evidence of storm damage, inlet proximity). • In the case of this study, geoindicators provide a reliable way to get an initial idea for the coastal setting of an area where previous studies have not been made. • For example, on Cayo Ratones, the northern shoreline was identified as having a high risk level. • Unlike the CVI, this approach is objective and qualitative. Parameters may be modified as Caribbean shoreline mechanics are better understood.
Cayo Ratones about 100 × 50 meters, surrounded by patchy reef. Beach sediment is calcareous, dominated by Halimeda. Plants include palm trees, mangroves, and non-native Australian pine trees. Accretion is occurring along the eastern and western portions of the island. The northern side is more exposed to wave and wind erosion. Mangroves have been planted. Rock walls are present along the eastern side. The island is used recreationally and reflects a high level of human impact. South-facing view of Cayo Ratones. Note the dense vegetation. Cayo Ratones, view toward the southwest. Main island of Puerto Rico visible in the background. Note pier, also shown above . Cayo Ratones, opposing view of photo to left , showing the accreting shoreline.
RTK GPS • AMBUR (Jackson et al., 2012) used to determine shoreline change. • Real Time Kinematic (RTK) Global Positioning System digitizes terrain resulting in a 3-D model. • RTK surveying includes Real Time corrections that reduce data ambiguity within millimeter accuracy • GPS station one serves as a control point continuously logging GPS data from space satellite. GPS station two, also known as the Rover Rod is mobile. The Rover Rod is relocated over the study area collecting the latitude, longitude and elevation. Approximately every 0.025 meters a reading is taken. OPUS automatically compares the control point data to the information being retrieved from GPS station two. Communication between stations is via radio satellite with Bluetooth connection.
Luna II beach, western side. Notice bolder size sediment. Media Luna I & II Luna I. Coarse-grain beach sediment deposits indicate moderate storm wave activity.
DEM Model A digital elevation model (DEM) of Media Luna (below, left) was made from the RTK data. 3-D model of Luna II View of Luna II taken from Luna I