Download
1 / 32
330 likes | 462 Vues
Tools for Measuring System and Application Performance. Introduction GlancePlus Introduction Glance Motif Glance Character Mode Glance Command-line Xverbosegc HPjmeter and –Xeprof Other Tools. Xverbosegc Understanding the Output By Generating Graphs. Xverbosegc output.

E N D
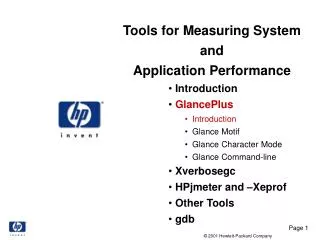
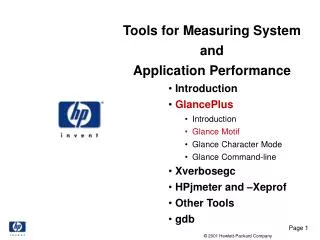
Tools for Measuring System and Application Performance • Introduction • GlancePlus • Introduction • Glance Motif • Glance Character Mode • Glance Command-line • Xverbosegc • HPjmeter and –Xeprof • Other Tools
Xverbosegc Understanding the Output By Generating Graphs
Xverbosegc output • Use -Xverbosegc:help for options • Analyzes new, old, and perm spaces • Prints data with no ASCII explanation • Goal: Low intrusion • Use awk script to format data • For example: -Xverbosegc:file=vbgc.out tail -f vbgc.out | awk -f processVerboseGC122.awk • Script available from www.hp.com/java
Xverbosegc - Output FileProcessing • Goal: Understand Garbage Collector and Java Heap Usage • Graphical view of data is essential • Use spreadsheet program to organize data • Graph using built-in graph maker • Use Excel as an example – Steps to follow: • Read Xverbosegc output file • Create graphs • Scatter graphs • X axis is time • Y axis is the value of the metric
Xverbosegc - Output FileOpen Xverbosegc Output File File:Open
Xverbosegc - Output FileOpen Xverbosegc Output File Select All Files
Xverbosegc - Output FileOpen Xverbosegc Output File Select Output File
Xverbosegc - Output FileOpen Xverbosegc File - Format Select “Delimited”
Xverbosegc - Output FileOpen Xverbosegc File - Format Select “Spaces”
Xverbosegc - Output FileOpen Xverbosegc File - Format Finish
Xverbosegc - Output FileCopy Time Column to First Column 1. Select “C” 2. Right Button over “C” for Menu
Xverbosegc - Output FileCopy Time Column to First Column Copy
Xverbosegc - Output FileCopy Time Column to First Column 1. Right Button over “A” for Menu 2. Paste
Xverbosegc - Output FileSelect Columns to Graph <CTRL> Right Button over “N”
Xverbosegc - Output FileStart Chart Wizard Insert:Chart…
Xverbosegc - Output FileChart Wizard – Select Scatter 1. Select “XY (Scatter)” 2. Next
Xverbosegc - Output FileChart Wizard – Label Chart + Axes Fill in Title and Axis Labels
Xverbosegc - Output FileChart Wizard – Remove Legend 1. Select “Legend” 2. Uncheck “Show” 3. Next
Xverbosegc - Output FileChart Wizard – Select Location Finish
Xverbosegc - Output FileChart Other Metrics • Repeat the process outlined selecting: • Column A Time application has run • Column: B GC Reason F MaxTenuringThreshold G, H, I Before, After, Capacity: Eden J, K, L Before, After, Capacity: Survivor M, N, O Before, After, Capacity: Old P, Q, R Before, After, Capacity: Perm S Time Required for GC
Xverbosegc - Output FileType of GC (B) -1: Scavenge (GC of New Generation only) 0-6: Full GC (collection of all spaces in Java Heap) Reason: 0: Call to System.gc 1: Old Generation full 2: Permanent Generation full 3: Train Generation full 4: Old generation expanded on last scavenge 5: Old generation too full to scavenge 6: FullGCAlot
Xverbosegc - Output FileSave the File as an Excel Workbook Save
Xverbosegc - Output FileSummary • Plotting the data • Is required for successful data analysis • Uncovers patterns of poor Java Heap behavior • Correctly labeled sets of graphs • Permit comparison of heap behavior: • Using different Java Heap options • Under different system loads • Allow correlation with output from other tools • Fosters an understanding of Java Heap behavior