Download
1 / 1
10 likes | 98 Vues
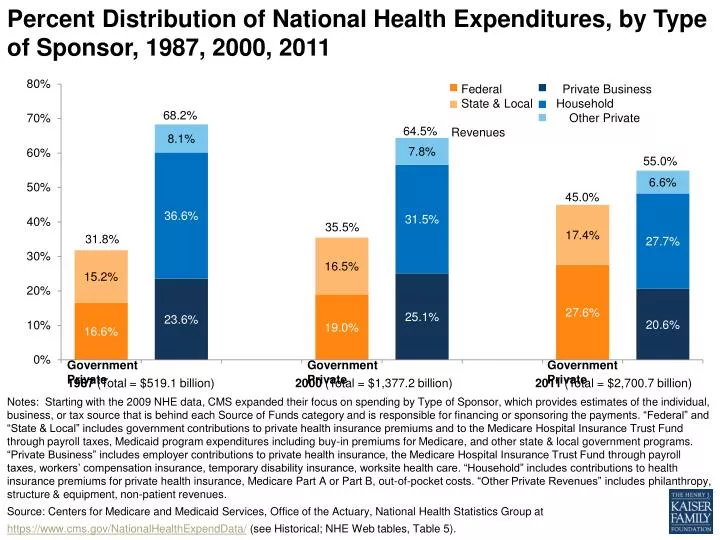
Percent Distribution of National Health Expenditures, by Type of Sponsor, 1987, 2000, 2011. Federal Private Business State & Local Household Other Private Revenues. 68.2%. 64.5%. 55.0%. 45.0%. 35.5%. 31.8%.

E N D
Percent Distribution of National Health Expenditures, by Type of Sponsor, 1987, 2000, 2011 Federal Private Business State & Local Household Other Private Revenues 68.2% 64.5% 55.0% 45.0% 35.5% 31.8% Government Private Government Private Government Private 1987 (Total = $519.1 billion) 2000 (Total = $1,377.2 billion) 2011 (Total = $2,700.7 billion) Notes: Starting with the 2009 NHE data, CMS expanded their focus on spending by Type of Sponsor, which provides estimates of the individual, business, or tax source that is behind each Source of Funds category and is responsible for financing or sponsoring the payments. “Federal” and “State & Local” includes government contributions to private health insurance premiums and to the Medicare Hospital Insurance Trust Fund through payroll taxes, Medicaid program expenditures including buy-in premiums for Medicare, and other state & local government programs. “Private Business” includes employer contributions to private health insurance, the Medicare Hospital Insurance Trust Fund through payroll taxes, workers’ compensation insurance, temporary disability insurance, worksite health care. “Household” includes contributions to health insurance premiums for private health insurance, Medicare Part A or Part B, out-of-pocket costs. “Other Private Revenues” includes philanthropy, structure & equipment, non-patient revenues. Source: Centers for Medicare and Medicaid Services, Office of the Actuary, National Health Statistics Group at https://www.cms.gov/NationalHealthExpendData/ (see Historical; NHE Web tables, Table 5).