Download
1 / 1
10 likes | 78 Vues
On the uses, benefits and interpretive meanings of latent variables in Comparative Effectiveness (CE) research Emil N . Coman & Judith Fifield , Ethel Donaghue TRIPP Center U. of Connecticut Health Center

E N D
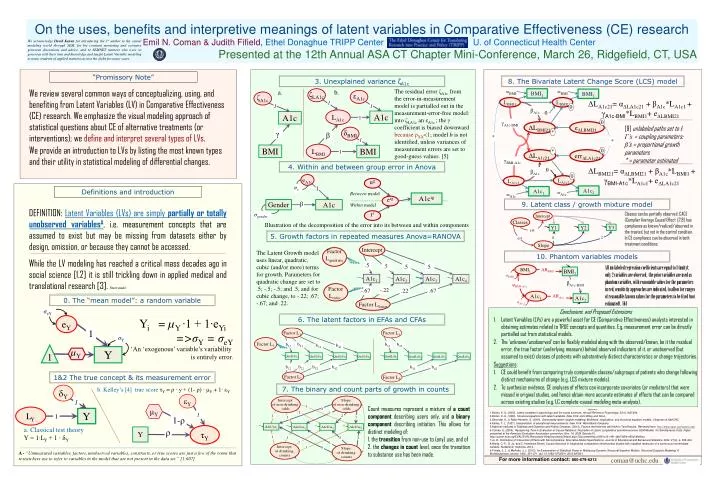
On the uses, benefits and interpretive meanings of latent variables in Comparative Effectiveness (CE) research Emil N. Coman & Judith Fifield, Ethel Donaghue TRIPP Center U. of Connecticut Health Center Presented at the 12th Annual ASA CT Chapter Mini-Conference, March 26, Ridgefield, CT, USA We acknowledge David Kenny for introducing the 1st author to the causal modeling world through SEM, for his constant mentoring and extensive generous discussions and advice, and to SEMNET mentors who were so generous with their time and knowledge and taught Latent Variable modeling to many students of applied statistics across the globe for many years . We review several common ways of conceptualizing, using, and benefiting from Latent Variables (LV) in Comparative Effectiveness (CE) research. We emphasize the visual modeling approach of statistical questions about CE of alternative treatments (or interventions); we define and interpret several types of LVs. We provide an introduction to LVs by listing the most known types and their utility in statistical modeling of differential changes. “Promissory Note” 8. The Bivariate Latent Change Score (LCS) model 3. Unexplained variance ζA1c The residual error ζA1cfrom the error-in-measurement model is partialled out in the measurement-error-free model: into ζLA1can εA1c ; the γ coefficient is biased downward because ρXX<1; model b is not identified, unless variances of measurement errors are set to good-guess values. [5] a. b. ΔLA1c21= αΔLA1c21 + βA1c*LA1c1 + γA1c-BMI*LBMI1+ eΔLBMI21 [9] unlabeled paths set to 1; Γ’s= coupling parameters; β’s = proportional growth parameters * = parameter estimated 4. Within and between group error in Anova ΔLBMI21= αΔLBMI21 + βA1c*LBMI1 + γBMI-A1c*LA1c1+ eΔLA1c21 DEFINITION: Latent Variables (LVs) are simply partially or totally unobserved variablesA, i.e. measurement concepts that are assumed to exist but may be missing from datasets either by design, omission, or because they cannot be accessed. While the LV modeling has reached a critical mass decades ago in social science [1,2] it is still trickling down in applied medical and translational research [3]. Start small: Definitions and introduction 9. Latent class / growth mixture model Classes can be partially observed: CACE (ComplierAverage Causal Effect [7,8] has compliance as known/realized/observed in the treated, but not in the control condition. In CE compliance canbeobserved in bothtreatment conditions. Illustration of the decomposition of the error into its between and within components 5. Growth factors in repeated measures Anova=RANOVA The Latent Growth model uses linear, quadratic, cubic (and/or more) terms for growth. Parameters for quadratic change are set to .5; -.5; -.5; and .5, and for cubic change, to -.22; .67; -.67; and .22. 10. Phantom variables models All un-labeled regression coefficients are equal to 1 (unity); only 2 variables are observed, the prior variables are used as phantom variables, with reasonable values for the parameters in red; sensitivity approaches are indicated, to allow for ranges of reasonable/known values for the parameters to be fixed (not estimated). [6] 0. The “mean model”: a random variable • Conclusions, and Proposed Extensions • Latent Variables (LVs) are a powerful asset for CE (Comparative Effectiveness) analysts interested in obtaining estimates related to TRUE concepts and quantities. E.g, measurement error can be directly partialled out from statistical models. • The ‘unknown/unobserved’ can be flexibly modeled along with the observed/known, be it the residual error, the true factor (underlying measure) behind observed indicators of it, or unobserved (but assumed to exist) classes of patients with substantively distinct characteristics or change trajectories. • Suggestions: • CE could benefit from comparing truly comparable classes/subgroups of patients who change following distinct mechanisms of change (e.g. LCS mixture models). • To synthesize evidence, CE analyses of effects can incorporate covariates (or mediators) that were missed in original studies, and hence obtain more accurate estimates of effects that can be compared across existing studies (e.g. LC complete-causal modeling meta-analysis). 6. The latent factors in EFAs and CFAs Yi= µY ∙1 + 1∙eYi =>σY = σeY ‘An ‘exogenous’ variable’s variability is entirely error. 1&2 The true concept & its measurement error 7. The binary and count parts of growth in counts b. Kelley’s [4] true score τY = ρ ∙ y + (1- ρ) ∙ μY+ 1∙ εY Count measures represent a mixture of a count component describing users only, and a binary component describing initiation. This allows for distinct modeling of: 1. the transition from non-use to (any) use, and of 2. the changes in count level, once the transition to substance use has been made. • References • Bollen, K. A. (2002). Latent variables in psychology and the social sciences. Annual Review of Psychology, 53(1), 605-634. • Bollen, K. A. (1989). Structural equations with latent variables. New York: John Wiley and Sons. • Skrondal, A., & Rabe-Hesketh, S. (2004). Generalized latent variable modeling: Multilevel, longitudinal, and structural equation models: Chapman & Hall/CRC • Kelley, T. L. (1927). Interpretation of educational measurements. New York: World Book Company. • National Institutes of Diabetes and Digestive and Kidney Diseases. (2014). Factors that Interfere with HbA1c Test Results. Retrieved from: http://www.ngsp.org/factors.asp. • Coman, E. (2009). Recapturing Time in Evaluation of Causal Relations: Illustration of Latent Longitudinal and Nonrecursive SEM Models for Simultaneous Data. Paper presented at the American Evaluation Association convention, Nov. 14, 2009 Orlando FL. http://comm.eval.org/EVAL/EVAL/Resources/ViewDocument/Default.aspx?DocumentKey=5f351c13-1f91-42b7-85fe-450d19f46fca • Jo, B., Estimation of Intervention Effects with Noncompliance: Alternative Model Specifications. Journal of Educational and Behavioral Statistics, 2002. 27(4): p. 385-409. • Wang, C.-P., B. Jo, and C. Hendricks Brown, Causal inference in longitudinal comparative effectiveness studies with repeated measures of a continuous intermediate variable. Statistics in medicine, 2014. • Prindle, J. J., & McArdle, J. J. (2012). An Examination of Statistical Power in Multigroup Dynamic Structural Equation Models. Structural Equation Modeling: A Multidisciplinary Journal, 19(3), 351-371. doi: 10.1080/10705511.2012.687661 a. Classical test theory Y = 1∙LY + 1 ∙ δY A - “Unmeasured variables, factors, unobserved variables, constructs, or true scores are just a few of the terms that researchers use to refer to variables in the model that are not present in the data set.” [1:607] For more information contact: 860-679-6213 coman@uchc.edu