Download
1 / 5
50 likes | 310 Vues
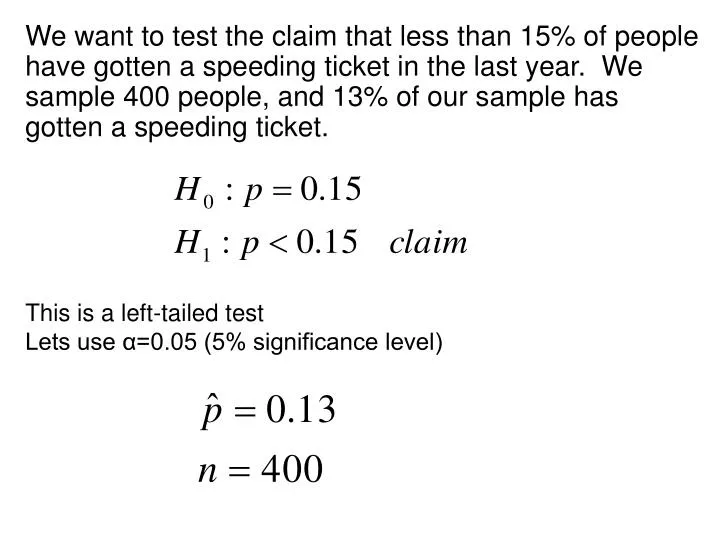
We want to test the claim that less than 15% of people have gotten a speeding ticket in the last year. We sample 400 people, and 13% of our sample has gotten a speeding ticket. This is a left-tailed test Lets use α=0.05 (5% significance level).

E N D
We want to test the claim that less than 15% of people have gotten a speeding ticket in the last year. We sample 400 people, and 13% of our sample has gotten a speeding ticket. This is a left-tailed test Lets use α=0.05 (5% significance level)
Is this z-value unusual (unlikely to occur by chance alone)? Traditional Method: The bottom 5% of possibilities occur at z-values less than -1.645 Since our test statistic does not fall below -1.645, our test statistic is not unusual (at the 5% significance level) Test Statistic:
Traditional Method: The bottom 5% of possibilities occur at z-values less than -1.645 Since our test statistic does not fall below -1.645 (in the critical region), our test statistic is not unusual (at the 5% significance level)
P-Value Method: What is the probability of getting a z-value less than -1.12? P(z<-1.12) = 0.1314 So a z-value less than -1.12 would occur in 13% of samples, even if p = 0.15. This is not unusual (doesn’t occur less than 5% of the time, based on our significance level).
Conclusion: There is not sufficient sample evidence to support the claim that less than 15% of people have gotten a speeding ticket in the last year. This doesn’t mean that we’re wrong, just that either the true proportion is not very much less than 15%, or that our sample size was not large enough to provide enough evidence.