Download
1 / 10
100 likes | 181 Vues
Figure S1 – Calibration curve SEC ideal mode. Figure S2 – SEC non ideal mode , day-to-day precision area of myoglobin and ovalbumin on BioSep ™ column. Figure S3 – SEC of IgG antibody ; retention times. Figure S4 – SEC of IgG antibody ; area of dimer.

E N D
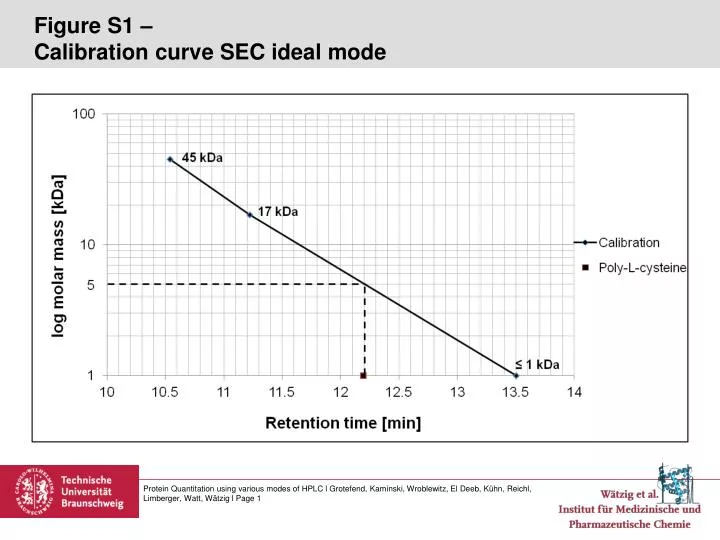
Figure S1 – Calibrationcurve SEC ideal mode Protein Quantitation using various modes of HPLC l Grotefend, Kaminski, Wroblewitz, El Deeb, Kühn, Reichl, Limberger, Watt, Wätzig l Page 1
Figure S2 – SEC non ideal mode, day-to-dayprecisionareaofmyoglobinandovalbuminon BioSep™column Protein Quantitation using various modes of HPLC l Grotefend, Kaminski, Wroblewitz, El Deeb, Kühn, Reichl, Limberger, Watt, Wätzig l Page 2
Figure S3 –SEC ofIgGantibody; retentiontimes Protein Quantitation using various modes of HPLC l Grotefend, Kaminski, Wroblewitz, El Deeb, Kühn, Reichl, Limberger, Watt, Wätzig l Page 3
Figure S4 –SEC ofIgGantibody; areaof dimer Protein Quantitation using various modes of HPLC l Grotefend, Kaminski, Wroblewitz, El Deeb, Kühn, Reichl, Limberger, Watt, Wätzig l Page 4
Figure S5 –SEC ofIgGantibody; areaof monomer Protein Quantitation using various modes of HPLC l Grotefend, Kaminski, Wroblewitz, El Deeb, Kühn, Reichl, Limberger, Watt, Wätzig l Page 5
Figure S6 –RP controlchartofpeakmyoglobin 2, day 3 Protein Quantitation using various modes of HPLC l Grotefend, Kaminski, Wroblewitz, El Deeb, Kühn, Reichl, Limberger, Watt, Wätzig l Page 6
Figure S7 – Separation ofmyoglobin, ovalbuminand BSA in SAX modeat different wavelength Protein Quantitation using various modes of HPLC l Grotefend, Kaminski, Wroblewitz, El Deeb, Kühn, Reichl, Limberger, Watt, Wätzig l Page 7
Figure S8 –RP blank injection, chemicalnoise Protein Quantitation using various modes of HPLC l Grotefend, Kaminski, Wroblewitz, El Deeb, Kühn, Reichl, Limberger, Watt, Wätzig l Page 8
Figure S9 –SAX blank injection Protein Quantitation using various modes of HPLC l Grotefend, Kaminski, Wroblewitz, El Deeb, Kühn, Reichl, Limberger, Watt, Wätzig l Page 9
Figure S10 – WCX blank injection Protein Quantitation using various modes of HPLC l Grotefend, Kaminski, Wroblewitz, El Deeb, Kühn, Reichl, Limberger, Watt, Wätzig l Page 10