Download
1 / 1
10 likes | 97 Vues
OMI validation by ground-based remote sensing: ozone columns and atmospheric profiles. A. Shavrina ,Ya. Pavlenko, A. Veles, I. Synyavsky, M. Sosonkin, Ya. Romanyuk, Yu. Ivanov, O. Monsar, N. Eremenko.

E N D
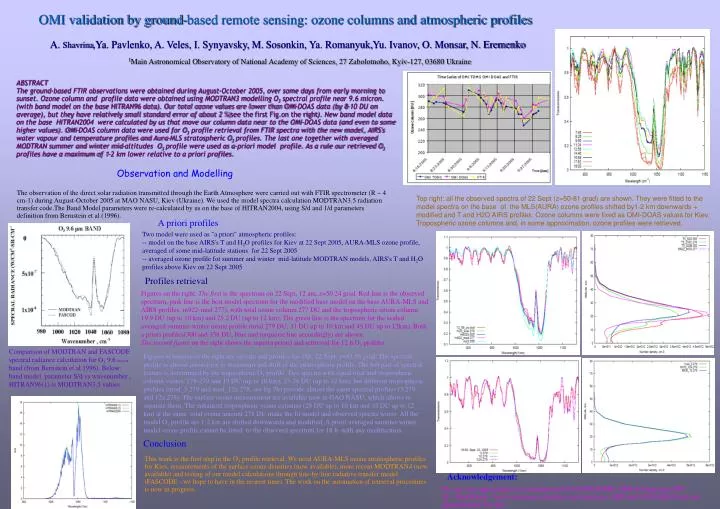
OMI validation by ground-based remote sensing: ozone columns and atmospheric profiles A. Shavrina,Ya. Pavlenko, A. Veles, I. Synyavsky, M.Sosonkin, Ya. Romanyuk,Yu. Ivanov, O. Monsar, N. Eremenko 1Main Astronomical Observatory of National Academy of Sciences, 27 Zabolotnoho, Kyiv-127, 03680 Ukraine ABSTRACT The ground-based FTIR observations were obtained during August-October 2005, over some days from early morning to sunset. Ozone column and profile data were obtained using MODTRAN3 modelling O3 spectral profile near 9.6 micron. (with band model on the base HITRAN96 data). Our total ozone values are lower than OMI-DOAS data (by 8-10 DU on average), but they have relatively small standard error of about 2 %(see thefirst Fig.on the right). New band model data on the base HITRAN2004 were calculated by us that move our column data near to the OMI-DOAS data (and even to some higher values). OMI-DOAS column data were used for O3 profile retrieval from FTIR spectra with the new model, AIRS's water vapour and temperature profiles and Aura-MLS stratospheric O3 profiles. The last one together with averaged MODTRAN summer and winter mid-altitudes O3 profile were used as a-priori model profile. As a rule our retrieved O3 profiles have a maximum of 1-2 km lower relative to a priori profiles. Observation and Modelling The observation of the direct solar radiation transmitted through the Earth Atmosphere were carried out with FTIR spectrometer (R ~ 4 cm-1) during August-October 2005 at MAO NASU, Kiev (Ukraine). We used the model spectra calculation MODTRAN3.5 radiation transfer code.The Band Model parameters were re-calculated by us on the base of HITRAN2004, using S/d and 1/d parameters definition from Bernstein et al.(1996). Top right: all the observed spectra of 22 Sept (z=50-81 grad) are shown.They were fitted to the model spectra on the base of the MLS(AURA) ozone profiles shifted by1-2 km downwards + modified and T and H2O AIRS profiles. Ozone columns were fixed as OMI-DOAS values for Kiev. Tropospheric ozone columns and, in some approximation, ozone profileswere retrieved. Apriori profiles Two model were used as "a priori" atmospheric profiles: -- model on the base AIRS's T and H2O profilesfor Kiev at 22 Sept 2005, AURA-MLS ozone profile, averaged of some mid-latitude stations for 22 Sept 2005 -- averaged ozone profile fot summer and winter mid-latitude MODTRAN models,AIRS's T and H2O profiles above Kiev on 22 Sept 2005 Profiles retrieval Figures on the right:The first is the spectrum on 22 Sept, 12 am, z=50.24 grad. Red line is the observed spectrum, pink line is the best model spectrum for the modified base model on the base AURA-MLS and AIRS profiles, m922-mod.277), with total ozone column 277 DU and the tropospheric ozone column 19.9 DU (up to 10 km) and 25.2 DU (up to 12 km). The green line is the spectrum for the scaled averaged summer-winter ozoneprofile(total 279 DU, 31 DU up to 10 km and 45 DU up to 12km). Both a prioriprofiles(300 and 358 DU, blue and turquoise line accordingly) are shown. The second figure on the right shows the input(a priori) and retrieved for 12 h O3 profiles. Comparison of MODTRAN and FASCODE spectral radiance calculation for O3 9.6 micron band (from Bernstein et al.1996).Below: band model parameter S/d vs wavenumber , HITRAN96(1) is MODTRAN3.5 values. Figures at bottom on the right are spectra and profiles for 18h, 22 Sept, z=81.95 grad. The spectral profile is almost insensitive to maximum and shift of the stratospheric profile. The left part of spectral feature is determined by the tropospheric O3 profile. Two spectra with equal total and tropospheric column values, 278-279 and 19 DU (up to 10 km), 25-26 DU (up to 12 km), but different tropospheric profiles (mod_3.279 and mod_12a.278, see fig 7b) provide almost the same spectral profiles (3.279 and 12a.278). The surface ozone measurement are available now in GAO NASU, which allows to separate them. The enhanced tropospheric ozone columns (28 DU up to 10 km and 35 DU up to 12 km) at the same total ozone amount 278 DU make the fit model and observed spectra worse. All the model O3 profile are 1-2 km are shifted downwards and modified. A priori averaged summer-winter model ozone profile cannot be fitted to the observed spectrum for 18 h with any modification. Conclusion This work is the first step in the O3 profile retrieval. We need AURA-MLS ozone stratospheric profiles for Kiev, measurements of the surface ozone densities (now available), more recent MODTRAN4 (now available) and testing of our model calculations through line-by-line radiative transfer model (FASCODE - we hope to have in the nearest time). The work on the automation of retrieval procedures is now in progress. Acknowledgement: We are very appreciative to Coordinator of ESA-NIVR-KNMI OMI-AO proposal 2907 , Dr. Mark Kroon, for his permanent attention and assistance, AIRS and AURA-MLS web-site adminisrations for data.