Download

1 / 39
400 likes | 408 Vues
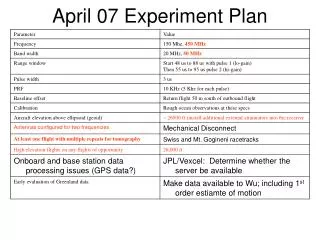
Practicability of the standard EN 14181 put into question: results of the LABORELEC study. WG Implementatie EN14181 in Vlaanderen April 07. Outline:. LABORELEC tests on QAL2: Protocol Some examples Findings summary : QAL2 QAL3 AST Conclusions. QAL2 assessment protocol:.

E N D
Practicability of the standard EN 14181 put into question: results of the LABORELEC study WG Implementatie EN14181 in Vlaanderen April 07
Outline: • LABORELEC tests on QAL2: • Protocol • Some examples • Findings summary : • QAL2 • QAL3 • AST • Conclusions.
QAL2 assessment protocol: • Two in-situ analysers in conventional Belgian power plants: • PROCAL: PULSI 240RL • SICK GM31 and GM35 • Parameters: • NO: 0-500 ppm and 0-1000 ppm • SO2: 0-600 ppm • CO: 0-200 ppm and 0-1000 ppm • Continuous recording of the AMSs and SRM outputs • Hourly averages distributed on three days. • No peripheral measurements taken into account.
PROCAL PULSI (1) • IR spectroscopy (IR wavelengths obtained by means of interference filters and gas filled cells (GCF)) • Auto zero checks. • Span checks should be possible with test gas.
SICK GM 31 (1) • Possible to measure simultaneously SO2, NO and optionally NO2 or NH3 • UV spectroscopy • Zero point measurement • Reference point measurement
SICK GM 31 (2) Sampling
SICK GM 35 • IR spectroscopy • CO • CO2 • H2O
Example 1a: cal. funct. obtained during different recording periods.
Example 1b: cal. funct. obtained during different recording periods
Example 2: cal. funct. obtained during the same recording period D = 52 ppm
Findings summary: 1/5 QAL 2 • Impossible to vary the pollutant concentration (as requested in § 6.3). • Irrelevant calibration function when: • measurements close to zero • Measurements not scattered enough • Markedly different calibration functions obtained on the same AMS (even during the same recording period). • Validation test not always relevant.
Findings summary: 1/5 QAL 2 • Impossible to vary the pollutant concentration (as requested in § 6.3). • Irrelevant calibration function when: • Measurements close to zero • Measurements not scattered enough • Markedly different calibration functions obtained on the same AMS (even during the same recording period). • Validation test not always relevant.
Findings summary: 1/5 QAL 2 • Impossible to vary the pollutant concentration (as requested in § 6.3). • Irrelevant calibration function when: • measurements close to zero • Measurements not scattered enough • Markedly different calibration functions obtained on the same AMS (even during the same recording period). • Validation test not always relevant.
Findings summary: 1/5 QAL 2 • Impossible to vary the pollutant concentration (as requested in § 6.3). • Irrelevant calibration function when: • measurements close to zero • Measurements not scattered enough • Markedly different calibration functions obtained on the same AMS (even during the same recording period). • Validation test not always relevant.
Findings summary: 2/5 QAL 2 • Validated range to narrow. • Too costly for: • Plants operating for short durations • With emissions much lower than the ELV. • Difficult to pass the variability test with high plant emission. • Why does the methodology proposed by the standard not include the uncertainty on the SRM measurements?
Findings summary: 2/5 QAL 2 • Validated range to narrow. • Too costly for: • Plants operating for short durations • With emissions much lower than the ELV. • Difficult to pass the variability test with high plant emission. • Why does the methodology proposed by the standard not include the uncertainty on the SRM measurements?
Findings summary: 2/5 QAL 2 • Validated range to narrow. • Too costly for: • Plants operating for short durations • With emissions much lower than the ELV. • Difficult to pass the variability test with high plant emission. • Why does the methodology proposed by the standard not include the uncertainty on the SRM measurements?
Findings summary: 2/5 QAL 2 • Validated range to narrow. • Too costly for: • Plants operating for short durations • With emissions much lower than the ELV. • Difficult to pass the variability test with high plant emission. • Why does the methodology proposed by the standard not include the uncertainty on the SRM measurements?
Findings summary: 3/5 QAL 2 QAL2 with low emissions? Extension of the calibration range based on linearity functional tests.
Findings summary: 4/5 QAL 3 • QAL1 data not available for existing AMS • Site data very difficult to obtain use of default values • Cusum chart is complicated and no example of Shewart chart provided • QAL3 does not make sense with AUTOCAL
Findings summary: 4/5 QAL 3 • QAL1 data not available for existing AMS • Site data very difficult to obtain use of default values • Cusum chart is complicated and no example of Shewart chart provided • QAL3 does not make sense with AUTOCAL
Findings summary: 4/5 QAL 3 • QAL1 data not available for existing AMS • Site data very difficult to obtain use of default values • Cusum chart is complicated and no example of Shewart chart provided • QAL3 does not make sense with AUTOCAL
Findings summary: 4/5 QAL 3 • QAL1 data not available for existing AMS • Site data very difficult to obtain use of default values • Cusum chart is complicated and no example of Shewart chart provided • QAL3 does not make sense with AUTOCAL Use of fixed warning limits What about auto zero and span checks?
Findings summary: 5/5 AST • Same findings as for QAL2 • Linearity and cross interference tests already checked during QAL1
Findings summary: 5/5 AST • Same findings as for QAL2 • Linearity and cross interference tests already checked during QAL1 Supress linearity and cross interference tests
Conclusions • Be careful • Some features have to be revised/ clarified: • QAL2 with low emissions? • Extension of the calibration range based on linearity functional tests. • Use of fixed warning limits • QAL3 utility • What about auto zero and span checks? We ask for a standard revision !
Current situation: CEN committee will publish a guidance note to support the application of the EN14181. (mainly based on the Technical guidance Note M20 published by the British Environment agency, www.environment-agency.gov.uk/business)
Five reasons for you to choose Laborelec : • You have one-stop shopping for your energy needs • You get access to more than 40 years of experience • You get rapid service with reliable solutions • You increase the profitability of your installations • You benefit from independent and confidential advice The technical Competence Center in energy processes and energy use. From R&D to operational assistance. LABORELEC