Download
1 / 15
150 likes | 158 Vues
Warm UP. 3. Compare the box-and-whisker plots below. Which player has the greater interquartile range? A. They are the same. B. Player B C. Player A. Mean Absolute Deviation. Essential Question: How do you use measures of central tendency and variation to describe data?. Standard:

E N D
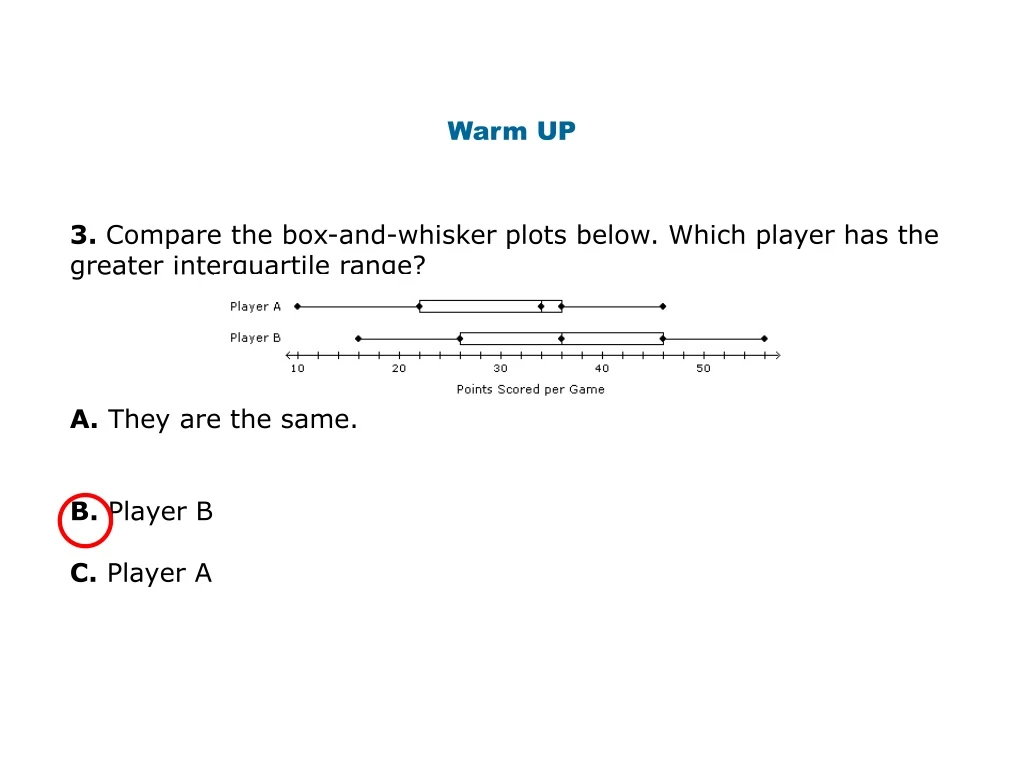
Warm UP 3. Compare the box-and-whisker plots below. Which player has the greater interquartile range? A. They are the same. B. Player B C. Player A
Mean Absolute Deviation Essential Question: How do you use measures of central tendency and variation to describe data? Standard: MCC7.SP.4: Use measures of center and measures of variability for numerical data from random samples to draw informal comparative inferences about two populations.
Here are the scores of 20 students from 2 classes who took the same quiz. • Find the mean of each class. • Find the range of each class • Based on the mean and range, do you think the classes performed at about the same level?
Here are the scores of 20 students from 2 classes who took the same quiz. • Make a line plot for class 1 and class 2. • Looking at the distribution of each line plot, do you agree with your previous answer of the classes performing on the same level?
Measures of SpreadQuantities that measure the degree of variation in data Even though their means and ranges are equal, the distributions of scores in Classes 1 and 2 are quite different. Most of the scores in Class 1 are either much higher or much lower than the mean. In contrast, most of the scores in Class 2 are closer to the mean. Range is a measure of spread which shows the difference of the highest and lowest values. A measure of spread that shows the difference between these distributions is called the mean absolute deviation, abbreviated m.a.d. Mean
Vocabulary • Deviation: The distance that two points are separated from each other. • Deviation from the mean: How far the data point is from the mean. To find this distance, subtract the two values (the data point and the mean). • Mean absolute deviation (MAD): the average distance of all the data points from their mean. Mean Absolute Deviation, is a better measure of dispersion than the standard deviation when there are outliers in the data
Mean Absolute DeviationFormula: MAD = difference of data and mean number of data values 1. Find the mean of the data. • Subtract the mean from each value – • the result is called the deviation from • the mean. • Take the absolute value of each • deviation from the mean. 4. Find the sum of the absolute values. 5. Divide the total by the number of items.
Example 1 Find the mean absolute deviation of the following test scores: • 87, 94, 72, 65, 97, 77
87, 94, 72, 65, 97, 7 Step 1: Write the data in the first column of the table.
87, 94, 72, 65, 97, 7 Step 2: Calculate the mean of the data and write that in each cell of column 2. 87 94 72 65 97 + 7 422 ÷ 6 = 70.3
87, 94, 72, 65, 97, 7 Step 3: Subtract column 1 from column 2 and write the difference in column 3. 70.3 – 87 = -16.7 70.3 – 94 = -23.7 70.3 – 72 = -1.7 70.3 – 65 = 5.3 70.3 – 97 = -26.7 70.3 – 7 = 63.3
87, 94, 72, 65, 97, 7 Step 4: Rewrite all the numbers from column 3 as positive numbers in column 4.
87, 94, 72, 65, 97, 7 Step 5: Calculate the mean of the data in column 4, and you’re done! This is the MAD. 16.7 23.7 1.7 5.3 26.7 + 63.3 137.4 ÷ 6 = 22.9
Example 2 Find the mean absolute deviation of the data. Round to the nearest hundredth, if necessary. • 87, 75, 85, 77, 74, 82 Click here to check your answer
87, 75, 85, 77, 74, 82 Solution: