Download

1 / 26
260 likes | 333 Vues
Moody's M3 Challenge: Modeling the Stimulus Plan. STAPLES HIGH SCHOOL, TEAM #143 KYLE BEATTY, JASON GANDELMAN, JUSTIN SHERMAN, NAVEEN MURALI, JONATHAN CHOI. American Recovery and Reinvestment Act. $787 billion stimulus package More disposable income consumer spending more employment

E N D
Moody's M3 Challenge:Modeling the Stimulus Plan STAPLES HIGH SCHOOL, TEAM #143 KYLE BEATTY, JASON GANDELMAN, JUSTIN SHERMAN, NAVEEN MURALI, JONATHAN CHOI
American Recovery and Reinvestment Act • $787 billion stimulus package • More disposable income consumer spending more employment • Goal: 3 million jobs by 2010 end
Problem • Which elements of this $787 billion package are most likely to produce the greatest improvements in employment? • How quickly can they be expected to produce results? • There is considerable discussion about a second stimulus package. If it is needed, how large should it be, and how should it be structured?
Assumptions All multipliers & MPC are constant with time Population is constant during 11 years. GDP deflator is constant for base year of 2000 There is no lag effect between spending, GDP, & employment
Categorization • Title I – Agriculture, Rural Development, Food and Drug Administration, and Related Agencies • Title II – Commerce, Justice, Science and Related Agencies • Title III – Department of Defense • Title IV – Energy and Water Development • Title V – Financial Services and General Government • Title VI – Homeland Security • Title VII – Interior, Environment, and Related Agencies • Title VIII – Departments of Labor, Health and Human Services, and Education, and Related Agencies • Title IX – Legislative Branch • Title X – Military Construction and Veterans Affairs and Related Agencies • Title XI – State, Foreign Operations and Related Programs • Title XII – Transportations and Housing and Urban Development • Title XIV – State Fiscal Stabilization Fund
Planning our Approach Spending: ARRA ? GDP ? Employment Rate
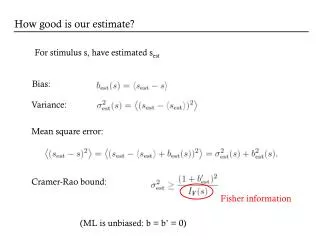
Keynesian Economics: Multiplier Effect • Multiplier Effect: increase in government spending creates multiplied increase in GDP • Why this works: • Marginal propensity to consume (MPC): fraction of every $1 received that is used for consumption
Infinite Geometric Series Multiplier Effect Can be Modeled by an Infinite Geometric Series
Applying Geometric Series Model • According to Council of Economic Advisors and Office of the Vice President-Elect: • Tax Relief multiplier: 0.98 • Infrastructure government spending multiplier: 1.75 • Non-infrastructure government spending multiplier: 1.30 • Multipliers were maximized after 8 quarters • Length of a spending round is approximately one quarter
Calculating MPC Non infrastructure Infrastructure Tax Relief
MPCs in Categorization • 6 Categories of ARRA • Tax Cuts • Aid for State and Local Governments • Relief • Infrastructure Spending • Energy Efficiency • Human Capital Uses Tax Cut MPC = 0.495 Uses Non Infrastructure MPC = 0.231 Uses Infrastructure MPC = 0.429 Uses Non Infrastructure MPC = 0.231
Multiple Spending Installments Linear Conversion Factor: 0.422 Percent Change in Employment Rate Number of Jobs Created or Saved Percent Change in Real GDP per Capita Cumulative Benefit to GDP
Effectiveness of Different Spending • Tax cuts • Very inefficient (Multiplier=0.98) • Large amount of spending • Infrastructure • Most efficient (Multiplier: 1.75) • Low amount of spending
Total Effectiveness 2010
Second Stimulus? Will not meet goal (3 million jobs by 2010): only 2.26 million jobs created by 2010 0.74 million jobs must be saved Government Spending GDP • $176.2 billion would have to be added to GDP Employment Rate Number of Jobs
Second Stimulus Plan Goal: to achieve required GDP increase with least amount of Government Spending Spending Priorities: Infrastructure Spending (Multiplier=1.75) Non-Infrastructure Spending Maximum Possible Spending Maximum Possible Spending (Multiplier=1.30) • Tax Cuts (Multiplier=0.98) Leftover
Second Stimulus Plan Finite amounts of Infrastructure & Non-Infrastructure spending possible Maximum spending must be determined by Congress Hypothetical Second Stimulus Plan
Conclusion • After 11 years, total 3.61 million jobs created/saved • Tremendous tax relief leads to greatest job creation (1.16 million) • Most efficient job creation: Infrastructure spending (1.75 multiplier) • Will not meet President Obama’s goal (3 million jobs by 2010): only 2.26 million created • Need 2nd stimulus plan: between $100 billion and $180 billion in additional spending
References • http://www.recovery.gov/?q=content/our-mission • http://otrans.3cdn.net/ee40602f9a7d8172b8_ozm6bt5oi.pdf • http://www.measuringworth.org/usgdp/ • http://data.bls.gov/PDQ/servlet/SurveyOutputServlet?data_tool=latest_numbers&series_id=LNS14000000 • Bade, Robin. Foundation of Economics: AP Edition. Pages: 770 • http://economistsview.typepad.com/economistsview/2008/12/woodward-and--1.html • The Job Impact of the American Recovery and Reinvestment Plan - Romer, Bernstein • http://kennebecjournal.mainetoday.com/view/columns/4738602.html • http://www.washingtonpost.com/wp-dyn/content/graphic/2009/02/01/GR2009020100154.html • http://www.bea.gov/newsreleases/national/pi/pinewsrelease.htm • http://www.usnews.com/articles/opinion/2008/12/31/us-population-2009-305-million-and-counting.html?s_cid=rss:us-population-2009-305-million-and-counting
Tax Multiplier • First round does not contribute to GDP • Tax Multiplier = MPC / (1-MPC)