Download
1 / 21
210 likes | 323 Vues
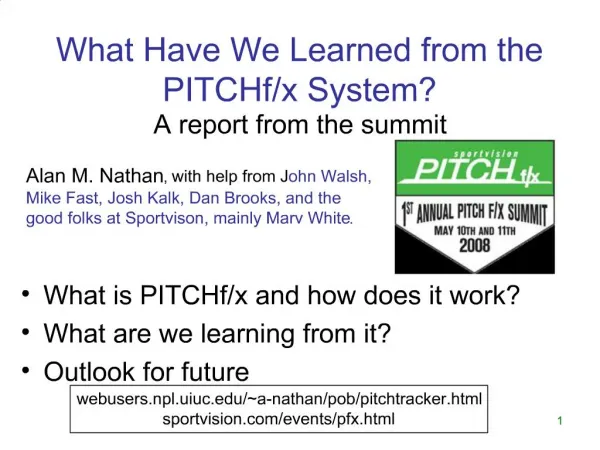
What have we learned from the John Day protocol comparison test?. Brett Roper John Buffington. AREMP. Watershed Sciences. This effort was a group (PNAMP) effort. UCB. $$ =. Goal – More efficiently collect and use stream habitat data. Objectives.

E N D
What have we learned from the John Day protocol comparison test? Brett Roper John Buffington
AREMP Watershed Sciences This effort was a group (PNAMP) effort UCB $$ =
Goal – More efficiently collect and use stream habitat data. Objectives • How consistent are measurements within a monitoring program, • Ability of protocols to detect environmental heterogeneity (signal-to-noise ratio), • Understand relationships among different monitoring program’s measurement of an attribute, and to more intensively measured values determined by a research team (can we share data?).
Sample Design • 7 monitoring programs • 3 crews • 3 channel types (12 streams) • Plane-bed (Tinker, Bridge, Camas, Potamus) • Pool-riffle (WF Lick, Crane, Trail, Big) • Step-pool (Whiskey, Myrtle, Indian, Crawfish) plane-bed pool-riffle step-pool Maximize variability so we can discern differences
Review of Design at a Stream Site Conduct surveys in late summer (base flow). Different End Points Depending upon protocol and crew Flow Set Begin Point Fixed Transects for Selected Attributes; Bankfull width, BF Depth, Banks,
On top of this “the truth”, “the gold standard” contour interval = 10 cm riffle bar survey points pool
-Objective 1 Within a program, many attributes are consistently measured ( ), some are less so ( ).
Egg-to-fry survival rates from estimates of percent fines ( ) from Potamus Creek (a) and WF Lick Creek (b), for two PIBO crews. SEF= [92.65/(1 + e-3.994+0.1067*Fines)]/100 Al-Chokhachy and Roper, submitted
Within Program Consistency • Most programs collect the majority of their attributes in a consistent manner. • When problems are identified within a protocol they can often be quickly addressed through minor changes (additional training, clarifying protocols, increasing operational rule sets). • QAQC is the only way to identify problems within a protocols. • Some sets of stream attributes (habitat units, sediment grain size) can be more difficult to be consistent with– problem is these are often the most important to aquatic biota. • Consistency is affected (+ and -) by transformations.
-Objective 2 Generally lower S:N than internal consistency. Two exceptions, Bankfull width and large wood.
Detecting Environmental Variability • Within this sample of streams there may not be sufficient signal in some variables (sinuosity --true, width-to-depth -- ??). • The focus on repeatability may reduce signal. Hard for me to look at the photo of the sites and not see a lot of variability. • In attributes where signal can be highly variable (large wood) transformations will almost always improve signal and increase the ability to tell differences.
Even if you are measuring the same underlying attribute, the more noise/less signal the weaker the estimate of the underlying relationship. Example; Assume you knew the truth perfectly but you compared that to imperfect protocol; how strong could the relationship be? (Stoddard et al. 2008; Kaufmann et al. 1999)
Objective 3 - Sharing Data • What are the ranges of relationships between programs given the signal to noise? • Given some inherent variability in our measurements are we measuring the same underlying attribute?
To minimize the effect of observer variation we use the mean of means. So although there is variation among crews in measuring sediment, it appears the monitoring protocols are measuring the same underlying characteristic.
In other cases it is clear programs are measuring different things – likely based on different operational definitions.
You can then relate each program to “the gold standard”. These coefficient of determination (r2) between intensively measured attributes and each program (mean of each reach).
What data could we share? Mostly • Bankfull • Residual Depth • Large Wood With Difficultly • Width to depth • Pools (%,/km) • Percent Fines Probably • Gradient • Sinuosity • Median Particle Size
Conclusions • Most groups do a decent job implementing their own protocol. Every group still has room for improvement through training, improved definitions,… • QAQC is key. • Groups seem to be forgoing some signal in order to minimize noise. • Difficult to exchange one groups result with another for many attributes. • Perhaps best as a block effect for those with no interaction.
Recommendations We will never progress on what is the right way without an improved understanding of the truth or agreed upon criteria. • How should we define a good protocol. • Which protocols have the strongest relationship with the biota? • Which best implies condition? • Which is closest to the real truth (ground based LiDAR)?
Issues for paper • I am trying to incorporate all the final suggestions and should have it out for a quick review then submission right after the new year.