Download
1 / 41
420 likes | 511 Vues
Explore the interaction between population and hazards, factors increasing risks, historical population trends, future projections, urban growth impacts, and real-world examples like Haiti and Chile quakes. Learn how economic standing plays a crucial role in disaster recovery.

E N D
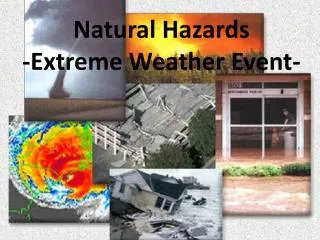
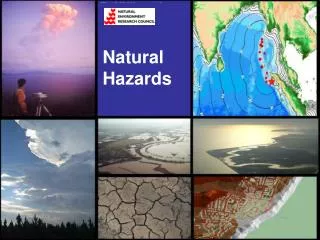
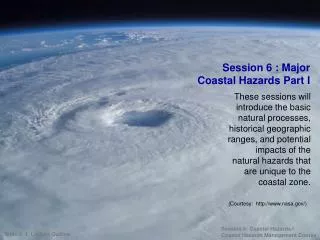
Where there is an interaction between hazard and population, there is the potential for a disaster or higher risk. Natural Hazard versus Population
Some factors that increase risk are: • Population density • Location in respect to the hazard • Economic standing
The Last 10,000 Years of Human History • Flat population growth curve until 8,000 years ago • Agriculture established • Domestication of animals • Growth rate increased to 0.036%/year • By 2,000 years ago, population ~200 million people • Better shelter, food, water supplies faster population growth • Growth rate of 0.056%/year • By 1750, population • ~800 million people Figure 1.8
The Last 10,000 Years of Human History • By 1750, population ~800 million people • Public health principles, causes of disease recognized • Birth rates soared, death rates dropped • 1810: ~1 billion • 1925: ~2 billion • 1960: ~3 billion Insert figure 1.10 here • 1974: ~4 billion • 1987: ~5 billion • 1999: ~6 billion • By 2013, projected population ~7 billion • Population growth is exponential Figure 1.10
The Human Population Today • Present population: Almost 7 billion • Growth rate = 1.2%/year • Doubling time = 58 years • Growth rate = • fertility (birth) rate – mortality (death) rate • Human population grows by about 80 million people per year
Future World Population • Demographic transition theory: • Mortality and fertility ratesdecline from high to low levels because of economic and social development • Population Reference Bureau estimates world population growth rates are dropping • From 1.8% in 1990 to 1.2% in 2008 • Due to urbanization and increased opportunities for women
Urban Growth: change from rural to urban population • The world’s urban population is now growing by 80 million persons per year • UNPF More developed regions World trend Least developed regions
Megacities By 2030, 66% of the world’s population will live in urban areas. How does this type of environment increase the amount of risk? Sao Palo, Brazil, 18 million people
Future World Population Figure 1.12
Demographic trends Developed countries Developing countries Higher birthrates Larger % of pop., young Lower life expectancy Become refugees due to political unrest 1 in 7 people in the world live in slum conditions • More education a woman receives the less children she will have • Higher life expectancy
Armenia, 1988 Developing Countries • Poorly designed or weak traditional structures Pakistan, 2005 Iran, 2001
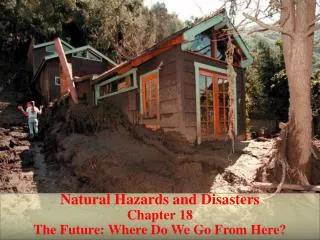
People often inhabit floodplain, hillsides and other “leftover” areas. • Lack resources • shelters are poorly constructed and population is concentrated. Problem?
Densely populated regions • Lack of strong structures • Narrow streets: inhibits exit of people and entrance of emergency vehicles • Lack of infrastructure: water • Closely packed wood structures: fires spread quickly • Lack of emergency services
Haiti: magnitude 7 earthquake January 12, 2010 222,570 people killed, 300,000 injured, 1.3 million displaced, 97,294 homeless Enriquillo-Plantain Garden fault system
Haiti • 2 million people in Port au Prince • Infrastructure for 100,000 • Housing: lack of reinforcement • 75% of population live on less than $2/day
Chile, M8.8 earthquake Subduction zone 528 people killed, many injured and at least 500,000 houses damaged
Chile Building codes similar to the United States About 30% of the population lives in poverty • Largest earthquake ever recorded in 1960 • Magnitude 9.5 • Magnitude 7.1, January 3, 2011 • Recovery continues
Economic standing: very important factor regarding risk and recovery
Deaths due to natural disasters • Most mega-killer disasters occur in densely populated belt through Asia, along Indian Ocean – number of fatalities is proportional to density of population
The number of disasters through time has increased Why? More hazards? More people in the way of hazards?
Disaster Frequency and Magnitude • The greater the magnitude, the rarer the event • How many people understood the potential hazard from a tsunami before 2004? • Haiti earthquake? Common Rare Low High Magnitude
Disaster Magnitude and Return Period • The greater the magnitude, the longer the return period • When was the last time a large earthquake occurred in California? Long Brief Low High Magnitude
Economic Loss • Includes destruction of: • Buildings and roads • Water and electricity • Businesses and industries • Employment • Takes years to determine
Insured losses • Developed countries have: • higher insured losses • Lower number of fatalities • Developing countries have: • lower insured losses • Higher number of fatalities • Increase in economic losses over time is result of increase in human population and urbanization
Carrying Capacity • How many people can Earth support? • Calculations of carrying capacityvary considerably • Increasing amounts of food can be produced • People can migrate from areas of famine or poverty to less crowded or wealthier areas • BUT Earth’s resources are finite, so solutions are temporary Figure 1.15
Carrying Capacity • Example of Rapa Nui (Easter Island) • Isolated Pacific island with poor soil and little water • Settled by 25-50 Polynesians in 5th century • Survived easily on chickens and yams, plenty of free time • Developed elaborate competition between clans with moai (statues) • Civilization peaked at 1550, with population of ~7000 Figure 1.14
Carrying Capacity • Example of Rapa Nui (Easter Island) • Reached by a Dutch ship in 1722 • Found about 2,000 people living in caves • Primitive society, constant warfare • Rapa Nui’s carrying capacityhad been drastically lowered by society’s actions: • Transportation of moai had required cutting down trees • Erosion of soil made yams scarce • Lack of canoes made fishing difficult and escape impossible
Bottom Line? • Larger events are less common • Increase cost due to increase economic loss • Increase of population • Change from rural to urban • Structures and population concentration without consideration of hazards • Carrying capacity: the ability for the population to live and thrive