Download
1 / 18
190 likes | 315 Vues
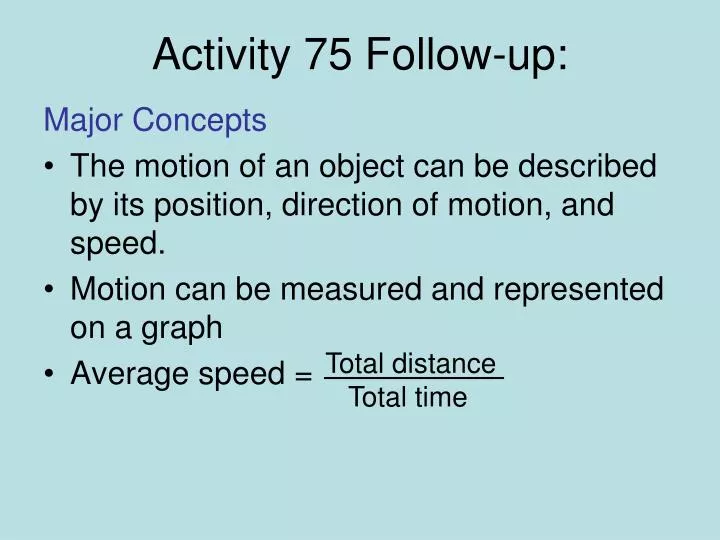
Activity 75 Follow-up:. Major Concepts The motion of an object can be described by its position, direction of motion, and speed. Motion can be measured and represented on a graph Average speed =. Total distance Total time. Analysis:.

E N D
Activity 75 Follow-up: Major Concepts • The motion of an object can be described by its position, direction of motion, and speed. • Motion can be measured and represented on a graph • Average speed = Total distance Total time
Analysis: • Identify a place on each graph where the slope of the line changes. What does a change in the slope of a motion graph indicate? A change in slope indicates a change in the distance traveled in a given time, which is defined as speed. It can also show you a change in direction.
2. Which student- Teasha or Josh- started out faster? Explain how you know this. Teasha started faster than Josh did. I know this because I looked at the graphs, and Teasha’s has a steeper slope than Josh’s. Her slope for the first segment is 0.5 mi/min, and Josh’s is 0.4 mi/min. Since Josh’s slope is less than Teasha’s, he wasn’t moving as fast.
How far into the trip did Josh turn around? Describe what the graph looks like at this point in the trip. Josh turned around 6 minutes after he left home—5 minutes traveling 2 miles and 1 minute stopped. You know this because from Minute 6 to Minute 10, the slope of the graph is negative (downward), which indicates a reversal in the direction of motion. With a positive (upwards) slope, the distance away from the starting point increases with time. With a negative slope, distance from the starting point decreases with time, which means that the car is getting closer, or traveling back toward, the starting point.
Look at the motion graphs shown below. Match the descriptions here to the correct graphs: a. Graph 2 b. Graph 4 c. Graph 1 d. Graph 3
5. A car that accelerates is one that speeds up, slows down, or changes direction. Which graph below shows a car continually accelerating? Explain how the shape of the graph shape shows this. Graph A shows an object accelerating. This is because it has a curved line that shows increasing steepness in slope as time increases. Graph B, in contrast, has a constant slope so it shows constant speed. Both graphs show motion in a straight line.
Activity 76 Title: Speed and Collisions
What do you think of when you hear the word “force”? • A force is defined as any push or pull that causes a change in motion. • A force is described by its magnitude and by the direction which it acts. • The SI unit for the magnitude, or strength, of a force is the newton (N). You exert about one newton of force when you lift an apple.
What do you observe when a force is acting on an object? • Although we can’t see forces, we indirectly observe them when we see something change its motion. • Bending, breaking, speeding up, stopping, changing direction, CHANGING VELOCITY.
Read E-16 Problem: Does vehicle speed affect the forces involved in a collision? Hypothesis: If _______ increases, then ____________________________.
Remember: you can’t see force. • You can feel force or see a change in motion that a force causes. • In this activity you will not actually be measuring force, you will be measuring the result of a force—the distance the struck block moves.
Procedure • Read procedure. • What were your results from activity 74? • What were the variables in activity 74? • Make sure you are consistent with the release and measurement.
Myth Busters: 100 mph Impact • http://videos.howstuffworks.com/discovery/40272-mythbusters-100mph-impact-video.htm
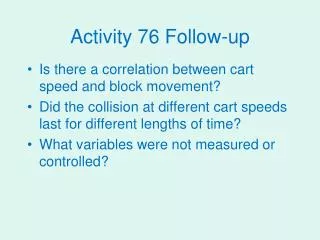
Discussion • What patterns do your data show? Increasing speed increases force! • What are the variables? Controlled variable? Tested variable? Responding variable? Which are dependent and independent?
Dependent or Independent? • An easy way to remember is to insert the names of the two variables you are using in this sentence in they way that makes the most sense. Then you can figure out which is the independent variable and which is the dependent variable: • (Independent variable) causes a change in (Dependent Variable) and it isn't possible that (Dependent Variable) could cause a change in (Independent Variable).
What is force? • It is a push or a pull • Force is required for any change in motion • At the point of impact, what happens to: The cart? The cart decelerates as it come to a stop. It also rebounded backwards in some cases • The block? • The block accelerates as it starts moving
Not only does the car apply force to the block, but the block also applies force to the cart Force of block on cart Force of cart on block Cart and block slows cart down speeds block up