Download
1 / 12
120 likes | 272 Vues
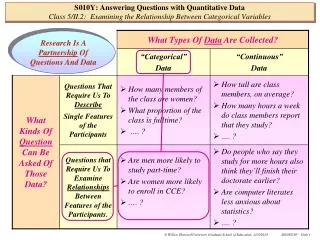
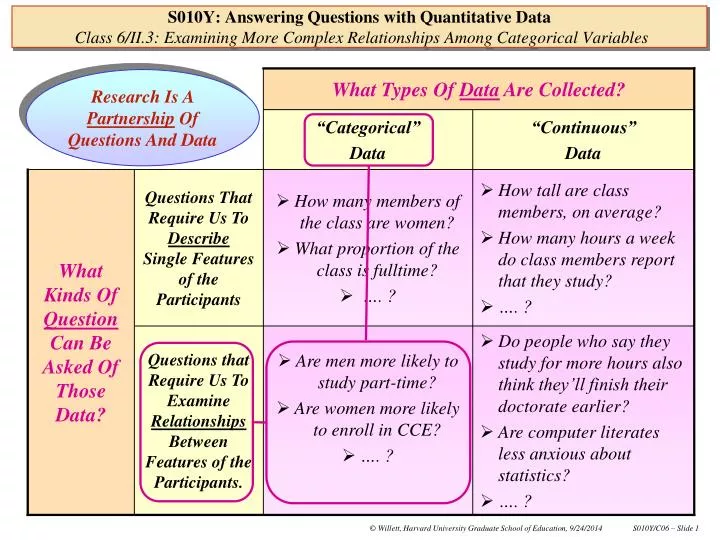
What Types Of Data Are Collected?. Research Is A Partnership Of Questions And Data. “Categorical” Data. “Continuous” Data. S010Y: Answering Questions with Quantitative Data Class 6/II.3: Examining More Complex Relationships Among Categorical Variables.

E N D
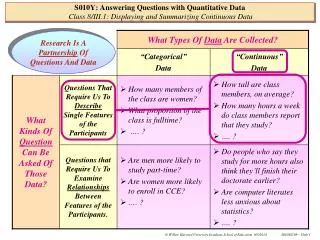
What Types Of Data Are Collected? Research Is A Partnership Of Questions And Data “Categorical” Data “Continuous” Data S010Y: Answering Questions with Quantitative DataClass 6/II.3: Examining More Complex Relationships Among Categorical Variables What Kinds Of Question Can Be Asked Of Those Data? Questions That Require Us To Describe Single Features of the Participants • How many members of the class are women? • What proportion of the class is fulltime? • …. ? • How tall are class members, on average? • How many hours a week do class members report that they study? • …. ? Questions that Require Us To Examine Relationships Between Features of the Participants. • Are men more likely to study part-time? • Are women more likely to enroll in CCE? • …. ? • Do people who say they study for more hours also think they’ll finish their doctorate earlier? • Are computer literates less anxious about statistics? • …. ?
How can we incorporate this additional variable into the contingency table analyses, to support and extend our original analyses? One straightforward approach is to simply replicate the original contingency table analysis in interesting “slices of the sample” defined by the new “third” variable. Today’s class! Recall that there is an additional variable in the DEATHPEN.txt dataset – the Race of the Defendant, RDEFEND, : S010Y: Answering Questions with Quantitative DataClass 6/II.3: Examining More Complex Relationships Among Categorical Variables 0 1 1 0 1 1 0 1 1 0 1 1 0 1 1 . (2475 cases) . 1 2 2 1 2 2 1 2 2
Sub-sample of Black defendants: Are DEATH and RVICTIM related? Sub-sample of White defendants: Are DEATH and RVICTIM related? • Then, inspect and compare answers across sub-samples • Would these supplementary analyses be able to further confirm a theory of racism in death penalty allocation? • What would we expect to find in the comparison across the supplementary analyses, if a racism theory were appropriate? Original sample of all defendants, in Georgia: Are DEATH and RVICTIM related? S010Y : Answering Questions with Quantitative DataClass 6/II.3: Examining More Complex Relationships Among Categorical Variables
In the options, titling, data-input and formatting parts of the PC-SAS program there is nothing new – any questions? The new “sliced into sub-samples” contingency table analysis is carried out in today’s Data-Analytic Handout … here’s the usual beginning of the PC-SAS program … OPTIONS NodatePageno=1; TITLE1 ‘S010Y: Answering Questions with Quantitative Data'; TITLE2 'Class 6/Handout 1: Examining More Complex Relationships Among Categorical Variables'; TITLE3 'Death Penalty and Victim Race, Accounting for Defendant Race'; TITLE4 'Data in DEATHPEN.txt'; *--------------------------------------------------------------------------------* Input data, name and label variables in dataset *--------------------------------------------------------------------------------*; DATA DEATHPEN; INFILE 'C:\DATA\A010Y\DEATHPEN.txt'; INPUT DEATH RDEFEND RVICTIM; LABEL DEATH = 'Sentenced to death?' RDEFEND = 'Race of defendant' RVICTIM = 'Race of victim'; *--------------------------------------------------------------------------------* Format labels for values of categorical variables *--------------------------------------------------------------------------------*; PROC FORMAT; VALUE DFMT 0 = 'No' 1 = 'Yes'; VALUE RFMT 1 = 'Black‘ 2 = 'White'; S010Y : Answering Questions with Quantitative DataClass 6/II.3: Examining More Complex Relationships Among Categorical Variables
Before you can conduct separate analyses by the values of a third variable, like RDEFEND, you have to sort the data by that variable, using the PROC SORT procedure. Notice how I have used the “race format” definition, RFMT, to provide value labels for both RVICTIM and RDEFEND. Any procedure in PC-SAS can be carried out in “slices” defined by the values of another variable, like RDEFEND, or even in slices defined by the values of several variables at the same time. Here’s the part that does the new “sliced into sub-samples” analyses …. *---------------------------------------------------------------------------* Carrying out the contingency table analyses separately by defendant race *---------------------------------------------------------------------------*; PROC SORT DATA=DEATHPEN; BY RDEFEND; PROC CHART DATA=DEATHPEN; TITLE5 'Displaying the Relationship Between DEATH & RVICTIM, by Defendant Race'; FORMAT DEATH DFMT. RVICTIM RDEFEND RFMT.; BLOCK RVICTIM / GROUP=DEATH DISCRETE; BY RDEFEND; PROC FREQ DATA=DEATHPEN; TITLE5 'Summarizing the Relationship Between DEATH & RVICTIM, by Defendant Race'; FORMAT DEATH DFMT. RVICTIM RDEFEND RFMT.; TABLES DEATH*RVICTIM / EXPECTED DEVIATION CHISQ CELLCHI2 NOROW; BY RDEFEND; RUN; S010Y : Answering Questions with Quantitative DataClass 6/II.3: Examining More Complex Relationships Among Categorical Variables
Black Murderers Black Victims When a Black victim is killed by a Black murderer, in Georgia 18/(1420+18) or 1.25% of the murderers are sentenced to death. Black Murderers White Victims When a White victim is killed by a Black murderer, in Georgia 50/(178+50) or 21.93% of the murderers are sentenced to death. “The percentage of Black murderers sentenced to death for killing a White victim is about seventeen and half times the percentage of Black murderers sentenced to death for killing a Black victim, in Georgia!!” Descriptive Analysis of Cases with Black Murderers, in Georgia S010Y : Answering Questions with Quantitative DataClass 6/II.3: Examining More Complex Relationships Among Categorical Variables
H0: DEATH & RVICTIM are not related, in the population of Black murderers in Georgia. Pearson χ2 statistic: 214.93 p-value: <.0001 (highly unlikely could’ve gotten a χ2 statistic as large as 214.93, or larger, by an accident of sampling from a null population). Decision: Reject H0 Conclusion: There is a statistically significant relationship between the allocation of the death penalty and the race of the victim, in the population of Black murderers in Georgia (p < .0001). Contingency Table Analyses of Cases with Black Murderers, in Georgia S010Y : Answering Questions with Quantitative DataClass 6/II.3: Examining More Complex Relationships Among Categorical Variables
Contingency Table Analyses of the Cases with Black Murderers, in Georgia • When the Murderer is Black…” • The largest contribution to the χ2 statistic is made when White victims are killed and a Black murderer has been sentenced to death (cell contribution to χ2 statistic=177.95). • In this cell, if there were no relationship between DEATH & RVICTIM, we would expect just over 9 death penalties. However, 50 death penalties were handed down. • The next largest contribution to the χ2 statistic is made when Black victims are killed and a Black murderer has been sentenced to death (cell contribution to χ2 statistic=28.21). • In this cell, if there were no relationship between DEATH & RVICTIM, we would expect around 59 death penalties. However, only 18 were given. S010Y : Answering Questions with Quantitative DataClass 6/II.3: Examining More Complex Relationships Among Categorical Variables
White Murderers White Victims When a White victim is killed by a White murderer, in Georgia 58/(687+58) or 7.79% of the murderers are sentenced to death. White Murderers Black Victims When a Black victim is killed by a White murderer in Georgia, 2/(62+2) or 3.13% of the murderers are sentenced to death. “The percentage of White murderers sentenced to death for killing a White victim is about two and half times the percentage of White murderers sentenced to death for killing a Black victim, in Georgia!!” Descriptive Analysis of Cases with White Murderers, in Georgia S010Y : Answering Questions with Quantitative DataClass 6/II.3: Examining More Complex Relationships Among Categorical Variables
Contingency Table Analyses of the Cases with White Murderers, in Georgia H0: DEATH & RVICTIM are not related, in the population of White murderers in Georgia. Pearson χ2 statistic: 1.86 p-value: .1722 (quite like that we could’ve gotten a χ2 statistic as large as 1.86, or larger, by an accident of sampling from a null population). Decision: Do Not Reject H0 Conclusion: There is no statistically significant relationship between the allocation of the death penalty and the race of the victim, in the population of White murderers in Georgia (p=.1722). S010Y : Answering Questions with Quantitative DataClass 6/II.3: Examining More Complex Relationships Among Categorical Variables
Contingency Table Analyses of the Cases with White Defendants • When the Murderer Is White … • The cell contributions to the χ2 statistic are all vanishingly small: • The observed frequency in each cell of the contingency table is indistinguishable from the frequency we would expect if there were no relationship between DEATH & RVICTIM. • When we do not reject the null hypothesis, we do not bother interpreting the ancillary statistics because they are probably just be consequence of sampling idiosyncrasy! S010Y : Answering Questions with Quantitative DataClass 6/II.3: Examining More Complex Relationships Among Categorical Variables
Final Conclusion: Georgia Death Penalty Analysis When the death penalty is handed down in Georgia, race makes a difference! We used contingency table analysis to examine categorical data on a sample of 2475 convicted murderers who had been convicted within the Georgia justice system. We knew the race of each of these murderers, the race of their victims and whether the death penalty had been awarded. Our principal research question asked whether there was a relationship between allocation of the death penalty and the race of the victim, in the population of murderers, and whether that relationship differed by the race of the murderer. While it is true that most murderers and their victims are of the same race and that only around 5% of all murderers are sentenced to death for their crimes, it is also true that the race of the victim plays an important role in the allocation of the most extreme penalty, as does the race of the defendant, as we now explain. In the sub-population of Black murderers, we detected a statistically significant relationship between the allocation of the death penalty and the race of the victim (χ2 statistic=214.93, p<.0001). We display the sample relationship in Figure 1. Frequencies listed in the figure reveal that, when a Black person was the victim, only 1.3% of convicted murderers were sentenced to death. When a White person was the victim, on the other hand, about 22% of murderers were sentenced to death –almost thirteen times the prior percentage! These differences are dramatic, and particularly so when a Black murderer has killed a White victim. Out of a total of 228 Black murderers in our sample who killed White victims, we would have expected the death penalty to be awarded to only nine of them, if there had been no relationship between the allocation of the death and the race of the victim. However, the most extreme penalty was awarded on in 50 cases! In the sub-population of White murderers, on the other hand, we found that we could not reject a null hypothesis of no relationship between the allocation of the death penalty and the race of the victim, in the population (χ2 statistic=1.86, p<.1722). In other words, whether their victim was Black or White, the proportion of White murderers who were sentenced to death was independent of the victim’s race. Finally, while our research design was observational, and not experimental, and cannot therefore support causal inferences, we believe that our findings are strong enough to be taken seriously. They reveal clearly the presence of a gross racial imbalance in the allocation of the death penalty in Georgia. S010Y : Answering Questions with Quantitative DataClass 6/II.3: Examining More Complex Relationships Among Categorical Variables