Download
1 / 15
150 likes | 272 Vues
The Association between Waist Circumference and Renal Insufficiency among Hypertensive Patients. Mrs. Watcharasa Pitug ID. 567110011-2. Contents. Introduction Objective Methods Results Conclusions. Introduction.

E N D
The Association between Waist Circumference and Renal Insufficiency among Hypertensive Patients Mrs. Watcharasa Pitug ID. 567110011-2
Contents • Introduction • Objective • Methods • Results • Conclusions
Introduction Chronic kidney disease (CKD) has become a global public health problem and is a common condition in the United States (Alejandro et al.,2009 ; Essam et al.,2008 ; Adam et al., 2007) In 2004, there were approximately 472,000 patients with treated ESRD (Alejandro et al.,2009 ) By 2030, expected to increase to more than 2 million. The estimated prevalence of earlier CKD stages (stages 1 through 4) in US adults was 24 to 28 million based on the 2000 (Adam et al., 2007)
Chronic kidney disease: classification and clinical consequences Relative risk of death in relation to kidney function (N=1,120,295 pts) CKD -KDOQI classification Go AS et., 2004
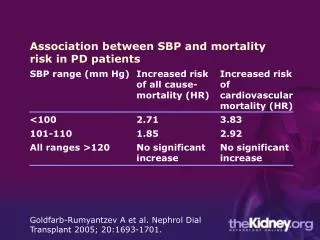
Modification of Diet in Renal Disease (MDRD) in Thailand In 2007 : Chronic Renal Insufficiency patients 13.2% in state 3 and 0.61% in state 4 (ThaweeSiriwong, 2007) In 2008 : Chronic Renal Insufficiency patients in Thailand 17.5% (สมาคมโรคไตแห่งประเทศไทย, 2008)
Clinical complications of renal failure Loss of erythropoietin –anaemia Parathyroid gland disturbances –renal bone disease Myocardial fibrosis and cardiomyopathy Active vitamin D deficiency Immunodeficiency Atherosclerosis and arteriosclerosis Malnutrition/wasting ..and many others Polyneuropathy No diuresis –overhydration
Gab of knowledge • The relationship of obesity to Renal insufficiency is somewhat controversial. While it is established that obesity increases the risk of hypertension, diabetes and dyslipidemia, it is not clear if excess abdominal waist circumference influences Renal insufficiency independently Correlation between waist circumference and (A) visceral and (B) subcutaneous fat areas assessed by using computed tomography in 75 men (open circle; dotted lines) and 47 women (filled triangle; solid lines) with prevalent chronic kidney disease. Fabiana et al.,2008
Objective • To investigate the association between abdominal waist circumference and Renal insufficiency among hypertensive patients Methods • A analytic study was conducted all information were collected from medical records of all patients diagnosed with Hypertension during 2012. The type of hypertension complications was based on Renal insufficiency was the main outcome of this study.
The inclusion flow chart Exclude DM & DMHT (xx,xxx) Exclude if not estimate waist circumference (xx,xxx)
Results Basic characteristic of the individual included in the study N=32,766
Basic characteristic of the individual included in the study N=22,167
Table 2. Crude odds ratios of having Renal Insufficiency and their 95% confidence intervals for each factor Waist Circumference P-value=0.877 (OR=0.99 ; 95%CI=0.85 to 1.14)
Table. 3. Odds ratios (ORs) of having Renal Insufficiency and their 95% confidence intervals for each factor adjusted for all other factors presented in the table using logistic regression (n=13151) Waist Circumference P-value=0.938 (Adjusted OR=1.01 ; 95%CI=0.82 to 1.24)