Download
1 / 26
260 likes | 421 Vues
The Great Recession of 2008-09: Starting to Build the Historical Perspective 29 A pril 2009. Wayne Carroll Department of Economics University of Wisconsin-Eau Claire carrolwd@uwec.edu. Why is this recession special?. Maybe the deepest since the Great Depression.

E N D
The Great Recession of 2008-09:Starting to Build the Historical Perspective29 April 2009 Wayne Carroll Department of Economics University of Wisconsin-Eau Claire carrolwd@uwec.edu
Why is this recession special? • Maybe the deepest since the Great Depression. • The government response to this one has been extraordinary and will have a lasting, historic impact. The fact that the government has done this tells us something; but what? Two possibilities: • They know something we don’t, and they’re scared. So we should be scared. • Maybe it’s a fairly ordinary recession, but they’ve decided to try new remedies. If so, then this marks a new era for macro policy.
How do we measure recessions? • Real GDP • Total employment • Unemployment rate • Bank credit • Industrial production • Home sales and prices • Stock market prices and other asset prices • Others A problem: we don’t have complete, detailed data from the Great Depression for comparison.
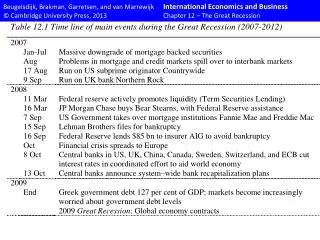
History’s lessons • The Great Depression • U.S. recessions: • 2001: following the bursting of the dot.com bubble • 1990-91: perhaps a consequence of the S & L crisis of the late 1980s • 1981-82: caused by the Fed’s anti-inflation policies • 1974-75: following a sharp spike in OPEC oil prices • The big five: Spain 1977, Norway 1987, Finland, 1991, Sweden, 1991, and Japan, 1992 (http://www.economics.harvard.edu/faculty/rogoff/files/Aftermath.pdf)
How did we get here? • Broad expansion in mortgage lending and increases in home prices in the 1990s, caused by: • Low interest rates from 2001 to 2004 • Relaxed lending rules and securitization of mortgages • Increases in interest rates starting in 2004 and slower growth or declines in home prices starting in 2005-07 raised mortgage default rates, causing financial problems for holders of mortgage-backed securities. (http://faculty.chicagobooth.edu/raghuram.rajan/research/TheCreditCrisisDougDiamondRaghuRajanAEADec2008.pdf)
How did we get here? • New loans were risky; but the market should have handled this. Market participants shared the risks, and they thought their risks were covered. Markets handle risks effectively all the time. Why not this time? The market knew how to handle risks facing a single enterprise -- a single mortgage borrower, or a single mortgage lender. If a single mortgage lender had failed, the market could have handled that. • But as risks were spread in new ways (or at an unprecedented scale), there was a heightened danger that a downturn could pull everybody down at once. Market participants weren’t hedging against this sort of broad risk, and it caught them. (http://www.hbs.edu/research/pdf/09-060.pdf)
How did we get here? • Consequence: a deep financial crisis • Lots of uncertainty, so banks and others couldn’t determine the value of many assets ==> toxic assets. • Drops in the values of assets eroded bank capital, which serves as a buffer against losses. Many banks have failed, and failure has become more likely for many others. • Banks and other financial institutions became reluctant to lend or to enter into other transactions, because they could not judge the soundness of potential borrowers and other counterparties. • Facing deep uncertainty, it makes sense for banks to cut their lending and build their capital back up to comfortable levels.
How did we get here? Data from the St. Louis Fed:http://research.stlouisfed.org/fred2/series/EQTA?cid=93
How does it look so far? • After 20 months, this recession is already the longest since the contraction of 1929-1933. Source: http://wwwdev.nber.org/cycles/cyclesmain.html
How does it look so far? 3.1% drop in last three quarters Data here and in the following charts from the St. Louis Fed
How Bad Might It Get? • Many economists forecast that the recovery will start in the third quarter of 2009. Source: http://online.wsj.com/public/resources/documents/info-flash08.html?project=EFORECAST07 See also: http://www.nytimes.com/2009/01/03/business/economy/03econ.html?scp=1&sq=blue%20chip%20forecast%202009&st=cse
How Bad Might It Get? Is that too optimistic? • A recent study of postwar financial crises (plus the Great Depression) found that recessions tend to be longer when they accompany financial or banking crises (like this one). • The average drop in per capita real GDP was 9.3%. (So far real GDP has dropped by 1.7% from its peak, and the consensus forecast predicts a total drop of 3.4%.) • The average decline in real GDP lasted for 2 years (from peak to trough). (17 months so far.) • The unemployment rate rises by an average of 7 percent, and its rise lasts an average of 4.8 years. (4% rise so far.) (http://www.economics.harvard.edu/faculty/rogoff/files/Aftermath.pdf)
How Bad Might It Get? More reasons to temper our optimism: • This recession is global in scope, so we can’t look elsewhere (such as strong exports or lending from abroad) for an easy recovery. (http://www.imf.org/external/pubs/ft/fandd/2008/12/collyns.htm) • The scary monster hiding under the bed: Japan in the 1990s – “the lost decade” • Housing bubble in late 1980s bank crisis in 1990s • Slow growth in real GDP and rising unemployment throughout the 1990s (http://www.frbsf.org/econrsrch/wklyltr/2000/el2000-19.html)
How Bad Might It Get? Japan in the 1990s: what we want to avoid! http://www.economist.com/finance/displaystory.cfm?story_id=13415153
How Bad Might It Get? Japan in the 1990s: what we want to avoid!
How Bad Might It Get? If I were a betting man… • The recovery will start later – after the third quarter of 2009. • The unemployment rate will set a new post-war record, passing the old record of 10.8%.
What Should We Do? History offers lessons: • Recessions can be long-lasting. • The Fed did not act decisively in the Great Depression – it “had to keep its powder dry for a real emergency.” • The Japanese government hesitated to address its bank capital issues in the 1990s, and this seems to have prolonged its slump.
What Should We Do? More lessons: • Sweden and other Scandinavian countries appeared to find effective remedies in the early 1990s: • Governments did not hesitate to act. • Banks were recapitalized fairly quickly. • Transparency: government plans were made public, and bank balance sheets were objectively assessed. (http://www.imf.org/external/pubs/ft/fandd/2008/12/ingves.htm)
What Should We Do? • Learning from history: • The Federal Reserve System is taking extraordinary steps to rescue the financial system. • The Fed increased the nation’s money supply at an annual rate of over 15% from September through March. • The Fed has dropped its target interest rate to essentially zero. • The Fed has injected hundreds of billions of dollars into banks, AIG, and other financial institutions. (http://www.federalreserve.gov/monetarypolicy/bst.htm)
What Should We Do? Changes in the Fed’s assets in the last two years (http://www.econbrowser.com/archives/2009/03/the_feds_new_ba.html#more)
What Should We Do? • Learning from history: • Emergency Economic Stabilization Act of 2008: • Troubled Asset Relief Program (TARP) – Treasury can spend $700 billion to recapitalize banks • The American Recovery and Reinvestment Act of 2009: • $787 billion injection of funds into the U.S. economy, including $212 billion in tax cuts, in the next ten years (http://cboblog.cbo.gov/?p=208) • Projected federal budget deficit for 2009 is $1.7 trillion dollars, or about 12% of GDP. (http://www.cbo.gov/doc.cfm?index=10014)
For more on this topic: Links to good background reading: • From the St. Louis Fed: http://timeline.stlouisfed.org/ • From the IMF: http://www.imf.org/external/pubs/ft/fandd/2008/12/index.htm • From the U.S. Treasury Department: http://www.financialstability.gov/index.html