Download
1 / 28
280 likes | 503 Vues
Different Measures of Health Status of Australians. Introduction. Various dimensions that contribute to health have been examined. Now – useful to look at health measures that allow judgments to be made about the health of individuals or populations.

E N D
Introduction • Various dimensions that contribute to health have been examined. • Now – useful to look at health measures that allow judgments to be made about the health of individuals or populations. • It is beneficial to look at a range of statistics (data) from different sources and population groups to give us accurate information (eliminate bias) • i.e. Would you class Australia’s health as being very good? Yes, however what about the indigenous population of Australia? Their health status is not as good as the rest of the population, but we would not know this if only whole population statistics were used. We know this because research has been done relating to different population groups.
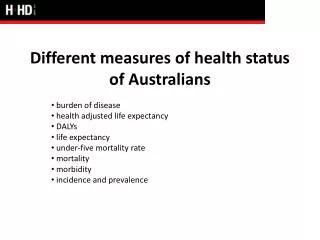
**Health Indicators** • There are a number of statistics or health indicators that give information on health status of groups and populations. Health indicators are: • - Life Expectancy • - Mortality • - Morbidity • - Burden of Disease • - Maternal Mortality • - Disability Adjusted Life • - Years • - Health Adjusted Life Years • - Under 5 mortality Rate • - Incidence • - Prevalence
Life Expectancy Quantity of life Definition - Is the number of years a person can expect to live if existing mortality patterns continue. • DOES NOT provide information on the health issues facing a country or a persons quality of life, it just gives the QUANTITY of life. • How is this calculated? • At birth current life expectancy figures relate to a baby born at the present time.
Health Adjusted Life Expectancy (HALE)Quality of life Definition – the number of years spent in full health that a person can expect to live, based on current rates of ill health and mortality. • This refers to the number of years lived without reduced functioning due to ill health • This is an indicator for Quality of Life
Question • What is the difference between Life Expectancy and Health Adjusted Life Expectancy (HALE)?
Life Expectancy & HALE Data ACTIVITY As a class write down all the comparisons you can make with this data.
Activity - Australian Bureau of Statistics handout • George is a 58 year old male. If mortality patterns continue, how old is he expected to live? • Work out your life expectancy • Would you expect HALE be different? If so how and why?
Mortality Definition - Refers to deaths in the population.
Mortality • Mortality data can also be collected for particular age or population groups, or for geographical areas. • Examples: • Under 5 mortality rate (the number of deaths of children from birth to their 5th birthday) • Infant mortality rate (deaths before 1st birthday) • Maternal Mortality Rate (death during or 42 days after pregnancy or terminated death of baby)
Interesting Facts • Australian Institute of health and welfare found in 2008: • 130,714 deaths were registered in 2005 • Male deaths outnumbered female deaths – 107 male deaths for every 100 female deaths • 25% of male deaths and 15% of female deaths were under the age of 65 • U5MR have fallen over time
Interesting Data Leading causes of death per 100,000 (in 2005)
Interesting Data Leading causes of death per 100,000 (in 2005)
Morbidity Definition - Refers to levels of illness and disability within a population • Morbidity rates are measure of how many people suffered from a particular condition during a given period of time.
MorbidityIncidence & Prevalence • Morbidity rates can look at incidence (the number or rate of newcases of a disease during a specified time)or prevalence (the total number of people experiencing a condition at a given time. Remember prevalence = previous
Mortality vs. Morbidity ‘As mortality rates have fallen, morbidity rates have increased’ Explain why this might be the case.
Mortality vs. Morbidity ‘As mortality rates have fallen, morbidity rates have increased’ As people are living longer, there is more time for biological, behavioral and environmental factors to have a negative impact on health.
Answer the following On a piece of paper write down how many times you went to the doctors in the last year (Feb 2011 – Feb 2012) and hand it to the teacher to calculate average visits per person. We will then compare this with the GP visit average from 2004-5 (5 visits per person)
Burden of Disease • Definition – a measure of the impact of diseases and injury. Burden of disease is measured in a unit called DALY • Is a statistic that combine mortality and morbidity figures and therefore focus on the total burden that a particular condition places on society Mortality no.+ morbidity no. = Burden of Disease • Burden of Disease is measured in a unit called the DALY
Disability Adjusted Life Year (DALY) • DALY is the unit of Burden of disease • 1 DALY = 1 healthy year of life lost • If 1000 DALYs were lost due to asthma, it means that 1000 years of healthy life have been lost (either by mortality or morbidity of people suffering the condition).
The Equation of calculating burden of disease YLL = Years of life lost (due to premature death) YLD = Years lived with disability (or injury)
Calculations • If someone dies from cancer at age 50 and their life expectancy was 78, cancer has taken away 28 years of life. • Life Expectancy - Age at Death = Years of Life Lost
Question • If someone dies from a disease at the age of 27 and their life expectancy was 82, what is their YLL? _______ - _______ = ______ YLL
Answer Life Expectancy - Age at Death = Years of Life Lost 82 - 27 = 55