Download
1 / 53
530 likes | 607 Vues
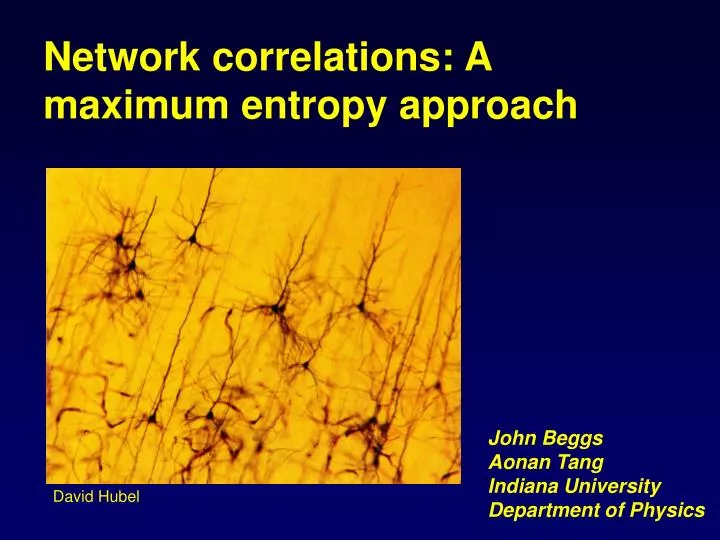
Network correlations: A maximum entropy approach. John Beggs Aonan Tang Indiana University Department of Physics. David Hubel. The brain is a complex system. Is there any way we could “simplify” it?. If so, could such an approach be applied to other complex systems?. Outline.

E N D
Network correlations: A maximum entropy approach John Beggs Aonan Tang Indiana University Department of Physics David Hubel
The brain is a complex system. Is there any way we could “simplify” it? If so, could such an approach be applied to other complex systems?
Outline • Correlated states • Maximum entropy • Spatial correlations • Temporal correlations
Outline • Correlated states • Maximum entropy • Spatial correlations • Temporal correlations
Data collected in collaboration with Alan Litke, UC Santa Cruz
Correlated activity Yet pairwise correlations are often weak!
Consider only single time bins Consider only ensembles of ~10 neurons Schneidman, et al, 2006
Puzzle: If four neurons each had a 0.01 probability of firing, what would be the probability of observing all 4 neurons firing at the same time? P = (0.01)4 = 0.00000001
But the data suggest that neurons are not independent Schneidman, et al, 2006
Multi-neuron firing patterns can be observed far more often than an independent model would predict: Schneidman, et al, 2006
A special model which considers only firing rate and pairwise correlations can do a good job of predicting correlated states: Let’s see how this model works Schneidman, et al, 2006
Outline • Correlated states • Maximum entropy • Spatial correlations • Temporal correlations
Main features of model: • Incorporate only firing rate and pairwise correlations • Assume parsimony (Occam’s Razor)
Main features of model: • Incorporate only firing rate and pairwise correlations • Assume parsimony (Occam’s Razor)
spikes Represent activity in each neuron as a spin: -1 -1 -1 -1 1 1 -1 1 -1 1 -1 -1 -1 -1 -1
Average activity in a neuron is given by the time average of this spin: < -1 -1 -1 -1 1 1 -1 1 -1 1 -1 -1 -1 -1 -1 >
< -1 -1 -1 -1 1 1 -1 1 -1 1 -1 -1 -1 -1 -1 > < 1 -1 -1 -1 -1 1 1 -1 -1 -1 1 1 -1 -1 -1 > We can also look at the time average of the product of spin pairs:
Extract from the data: Firing rate: Pairwise correlations:
The observed quantities <si> and <sisj> will influence the spins: (Ising model)
Where <si> is the local magnetic field hi And <sisj> is the couplingJij hi = Jij = (Ising model)
h2 = +0.5 J12 = -0.3 h1 = -0.9 J23 = -0.3 J13 = +0.9 h3 = -0.9 For example:
How well each spin agrees with its connected neighbors How well each spin agrees with its local magnetic field A particular choice of h and J values will assign different energies to each spin configuration:
Main features of model: • Incorporate only firing rate and pairwise correlations • Assume parsimony (Occam’s Razor)
Puzzle: What does it mean to have maximum parsimony? Or to have the least complex model? Can we quantify this somehow?
If you had to draw a curve through these points, what would you draw?
If you had to draw a curve through these points, what would you draw? Probably not!
If you had to draw a curve through these points, what would you draw?
If you had to draw a curve through these points, what would you draw? Why is this more likely?
Probability 1 2 3 4 5 Number If you were going to pull a number (1, 2, 3, 4, 5) out of a hat, what probability distribution would you assume?
5 Probability 4 3 2 1 Number If you were going to pull a number (1, 2, 3, 4, 5) out of a hat, AND I told you the mean value of the distribution was 4, what probability distribution would you assume?
5 Probability Probability 4 1 2 3 4 5 3 2 1 Number Number In the first case, you chose the maximum entropy distribution with no constraints In the second case, you chose the maximum entropy distribution subject to the constraint of a given mean
Maximizing entropy is maximizing uncertainty. Maximizing entropy is also maximizing simplicity.
Probability Energy Regarding the energies of the system: Assume that there is a mean energy Assume further that there is a maximum and a minimum energy How will the system populate these energy states? Maximum Entropy
Probability Energy This is just a Boltzmann distribution:
Now we can see how the different spin configurations will be distributed: The lowest energies are the most probable; the highest energies are the least probable.
So, our task is to select a set of h and J values that give a distribution of spin configurations most like that observed in the data h and J are really Lagrange multipliers, and this is a problem from the calculus of variations
Steps in procedure: • Pick some set of h, J values • Plug these into the energy formula • Calculate the energy of each configuration • Calculate the probability of each configuration (Boltzmann distribution) • Compare the model’s probability distribution with the data’s • Adjust the h and J values to produce a better fit with the data • Repeat loop until satisfactory fit is obtained
Outline • Correlated states • Maximum entropy • Spatial correlations • Temporal correlations
Assuming that this can be done, how well does the model perform? Schneidman, et al, 2006
Assuming that this can be done, how well does the model perform? Data from our lab and colleagues
Assuming that this can be done, how well does the model perform? Works for cortical tissue, not just retina Works for local field potentials
Information from model Information from data While this may “look” good, is there any objective way to quantify performance?
In their studies, the model accounted for ~90% of the available information Schneidman, et al, 2006
In our studies, it did about the same on a variety of tissues:
Outline • Correlated states • Maximum entropy • Spatial correlations • Temporal correlations
Can the model predict sequences? Is activity in these five time bins correlated over time? Schneidman, et al, 2006
Concatenated states from the model compared to data 9/13 length distributions significantly differ
The model can predict spatial, but not temporal, correlations. Could the model be extended to account for temporal correlations?