Download
1 / 4
50 likes | 154 Vues
Good Y. 6. A. 2. B. 0. 2. 8. Good X. Tool: production possibility frontier. Suppose it is possible for Holland to produce 2 units of good X and 6 units of good Y. If we plot good X horizontally and good Y vertically this is represented by point A.

E N D
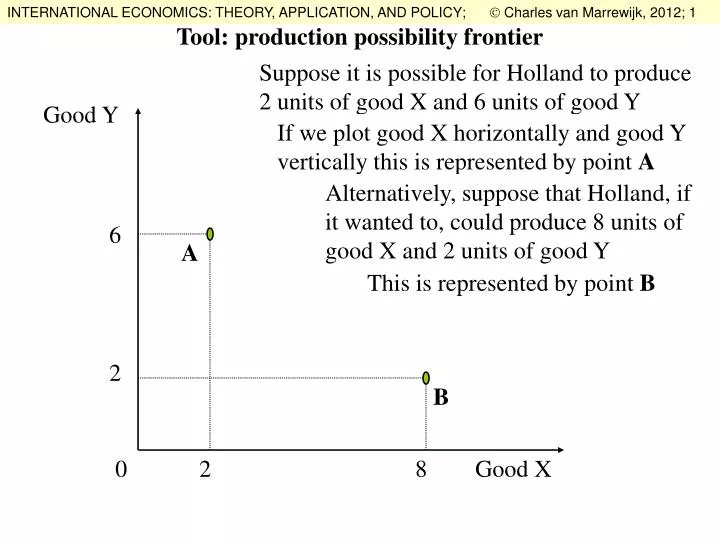
Good Y 6 A 2 B 0 2 8 Good X Tool: production possibility frontier Suppose it is possible for Holland to produce 2 units of good X and 6 units of good Y If we plot good X horizontally and good Y vertically this is represented by point A Alternatively, suppose that Holland, if it wanted to, could produce 8 units of good X and 2 units of good Y This is represented by point B
Good Y B 0 Good X Tool: production possibility frontier Perhaps, Holland cannot only produce combinations A and B but many other different combinations also Here we have drawn a few We call the line connecting all possible different combinations the production possibility curve (or prod. pos. frontier; ppf) A
Note that the production possibility curve only connects Point C (2 X and 2 Y) can be produced by Holland, but it could produce more of Y (at A) or more of X (at B) or more of both goods (the red line between A and B) C Tool: production possibility frontier Good Y efficient production combinations. A B 0 6 Good X
Thus, the production possibility curve represents efficient Good Y output combinations. All possible combinations of final output (including non-optimal combinations) is called the production possibility set 0 Good X Tool: production possibility frontier