Download
1 / 17
170 likes | 248 Vues
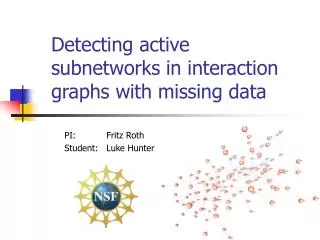
Detecting active subnetworks in molecular interaction networks with missing data. Luke Hunter Texas A&M University SHURP 2007 Student. Outline of Talk. Introduction Overall Strategy Previous Papers Graph Construction Scoring Function Search Approaches Experiments Future Work.

E N D
Detecting active subnetworks in molecular interaction networks with missing data Luke Hunter Texas A&M University SHURP 2007 Student
Outline of Talk • Introduction • Overall Strategy • Previous Papers • Graph Construction • Scoring Function • Search Approaches • Experiments • Future Work
Introduction • Background: • Ideker et al. define an ‘active subnetwork’ as a connected set of genes with unexpectedly high levels of differential expression • Objective: • Find active subnetworks of metabolites • Motivation: • High throughput data analysis • Mechanisms • Cell state (disease, drug treatment, and environment)
Overall Strategy • Build graph • Obtain data (p-values) • Create scoring function • Find high-scoring subsets • Validate results
Previous Papers (1):Ideker et al. (2002) “Discovering regulatory and signalling circuits in molecular interaction networks” Goal:find active subnetworks • Graph • Galactose utilization (~300 nodes, ~300 links) • P-P & P-DNA for yeast (~4000 nodes, ~7500 links) • Data from perturbations of GAL pathway • Scoring • Aggregate z-score & calibration (more later) • Scoring over multiple conditions • Searching • Simulated Annealing • Results • Don’t contradict literature • Breaks up / organizes data
Previous Papers (2):Rajagopalan & Agarwal (2004) “Inferring pathways from gene lists using a literature-derived _network of biological relationships” Goal:maximally include query list in minimal subset • Graph • Gathered data from 3 sources (~9000 nodes, ~30,000 links) • Scoring • Used aggregate z-score & calibration (from Ideker, 2002) • Modified to consider node degree and node significance • Searching • Greedy Algorithm with DFS • Results • Experiments are not convincing
Graph Construction • KEGG Data (Kanehisa et al.) • Nodes: ligands (i.e.--compounds, glycans, & drugs; ~25,000) • Links: reactions (~29,000) • Measured Data • Chronic ischemia (304 ligands) • Glucose tolerance (124 ligands) • Planned myocardial infarction (107 ligands) • Problems with measured data • Ambiguity • Not in KEGG • Duplicates
Scoring Functions (1) • Use aggregate z-score of Ideker • Create “corrected” node score • Modify for node significance • Modify for node degree • Discrepancy with Ideker paper Ideker et al. (2002) Whitlock (2005) Naïve Rajagopalan & Agarwal (2004)
Scoring Functions (2) Significance vs. Strength Piecewise Function Geometric Mean Weighted Geometric Mean
Scoring Functions (3) Establish Significance of Scores • Scramble • Search • Obtain distribution
Search Approaches (1):Simulated Annealing Ideker et al. 2002
Search Approaches (2):Greedy Algorithm w/ DFS • Build graph and calculate corrected node scores • Use BFS to group nodes with positive corrected scores • For each connected component do a limited DFS and try to merge with nearby connected components if merge would increase the overall score • Prune nodes with small z-scores (so long as connectivity is maintained)
Future Goals • Remove “distant” unknown nodes? • Evaluate scoring functions • Evaluate search strategies • Implement Google MapReduce • Apply to more data sets • Use cytoscape software
Acknowledgements • NSF REU Program • Fritz • Gabriel • Everyone else
References • Ideker, T., Ozier, O., Schwikowski, B., and Siegel, A.F. 2002. Discovering regulatory and signalling circuits in molecular interaction networks. Bioinformatics 18: S233–S240. • Rajagopalan, D., & Agarwal, P. (2005). Inferring pathways from gene lists using a literature-derived network of biological relationships. Bioinformatics 21, 788–793. • Whitlock, M. (2005). Combining probability from independent tests: the weighted Z-method is superior to Fisher’s approach. J. Evol. Biol.16, 1368-1373. • Kanehisa, M., Goto, S., Hattori, M., Aoki-Kinoshita, K.F., Itoh, M., Kawashima, S., Katayama, T., Araki, M., and Hirakawa, M.; From genomics to chemical genomics: new developments in KEGG. Nucleic Acids Res.34, D354-357 (2006). • Dean, J., & Ghemawat, S. (2004). MapReduce: Simplified Data Processing on Large Clusters. OSDI 2004.