Download
1 / 18
180 likes | 316 Vues
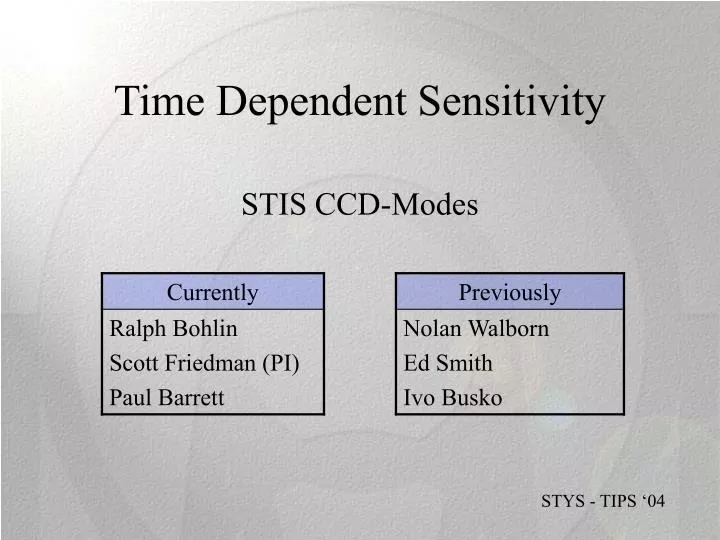
Time Dependent Sensitivity. STIS CCD-Modes. STYS - TIPS ‘04. TDS: Time Dependent Sensitivity. Monitor the sensitivity of each CCD grating mode to detect any changes due to contamination or other causes.

E N D
Time Dependent Sensitivity STIS CCD-Modes STYS - TIPS ‘04
TDS: Time Dependent Sensitivity • Monitor the sensitivity of each CCD grating mode to detect any changes due to contamination or other causes. • Prior to analysis we first account for temperature dependencies as well as losses due to CTE. • Create reference files for use in the STIS data-reduction pipeline to correct extracted 1D spectra for time dependent sensitivity losses.
Observations • AGK+81D266 is a flux standard sub-dwarf whose position allows for observations throughout the year. • CRSPLIT = 2 for cosmic ray rejection; CCDGAIN=1 (default) • G750L and G750M observations have contemporaneous fringe flat exposures for fringe removal.
G230LB AGK+81D266 • 1700-3000 angstroms • 173 sec. exposure • 34 observations Net Count Rate Wavelength (A)
G430L AGK+81D266 • 2900-5700 angstroms • 173 sec. exposure • 35 observations Net Count Rate Wavelength (A)
G750L AGK+81D266 • 5500-9900 angstroms • 432 sec. exposure • 35 observations Net Count Rate Wavelength (A)
The Problem G230LB t0 ~ 1997 t1 ~ 2004 Net Count Rate Wavelength (A)
The Ratio Obsn/Reference t0 ~ 1997 t1 ~ 2004 0.91 t1/t0 Wavelength (A)
1%/yr - 3%/yr Avg. G230LB Trends 1.10%/yr +/- 0.19 sig = 0.23% -1.79%/yr +/- 0.10 sig = 0.59% -0.43%/yr +/- 0.43 sig=0.59%
0.2%/yr Avg. G430L Trends
Typically 0%/yr Avg. G750L Trends
Pipeline Implementation t0 ~ 1997 G230LB t1 ~ 2004 Flux • A TDS reference file contains MJDs and slopes at each wavelength bin. • calSTIS uses linear interpolation to correct each observation based on wavelength and epoch. • The result is an extracted 1D flux spectrum corrected for both TDS and CTE.
G230LB Uncorrected Net Count Rate Corrected FLUX Side 2 Electronics 1.10%/yr +/- 0.19 sig = 0.23% -1.79%/yr +/- 0.10 sig = 0.59% -0.43%/yr +/- 0.43 sig=0.59%
G430L Uncorrected Net Count Rate Corrected FLUX
G750L Uncorrected Net Count Rate Corrected FLUX
Summary • STIS sensitivity has been monitored since activation and is dependent on time, temperature and wavelength. • Sensitivity losses in the CCD modes range from 0%/yr (G750L) to ~3%/yr (G230LB) • M-mode sensitivities mimic the trends found in the L-modes. We apply the L-mode corrections to the M-modes since we only observe medium dispersion modes at selected wavelengths. • TDS reference files are available for first-order MAMA and CCD modes. In the future, imaging and echelle modes will also be corrected for TDS.