Download
1 / 22
240 likes | 1.03k Vues
1 H NMR Interpretation. Number of Signals (Resonances) Position of Signals (Chemical Shift) Peak Integrations Splitting Patterns (Multiplicity) Exchangeable Protons. Number of Signals – Simple Cases. Number of Signals – Complex Cases. 11 signals?. 6 signals?. 90 MHz spectrum:.

E N D
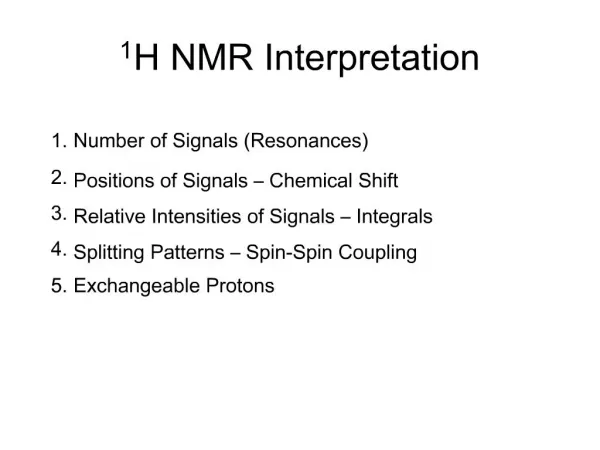
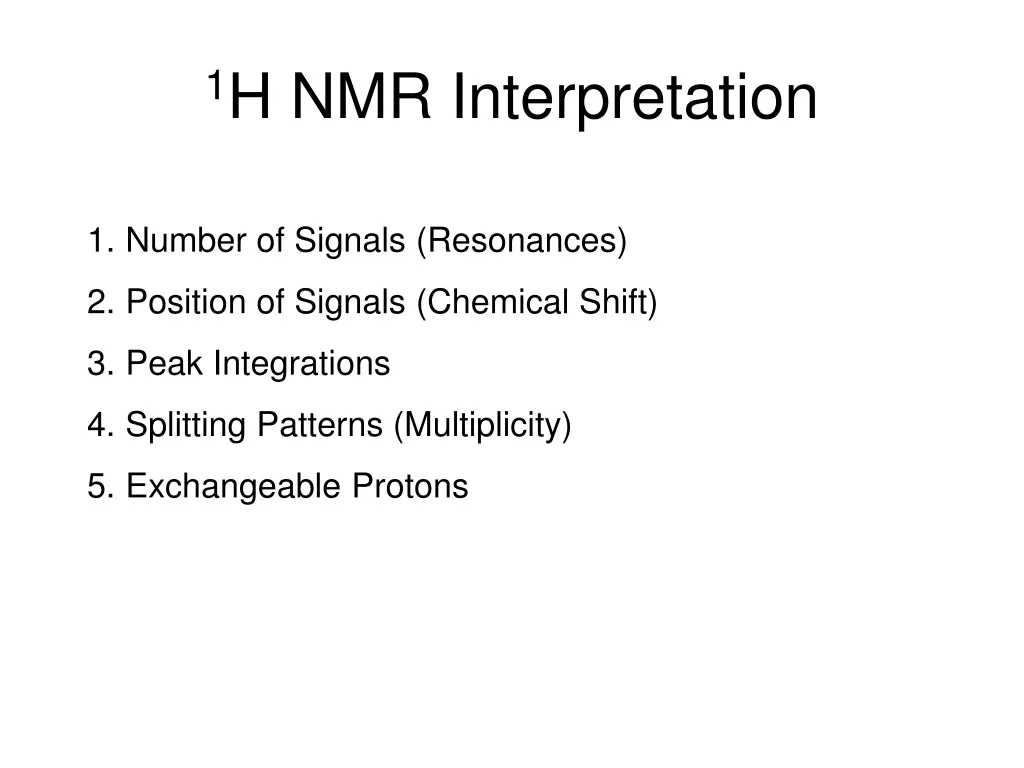
1H NMR Interpretation • Number of Signals (Resonances) • Position of Signals (Chemical Shift) • Peak Integrations • Splitting Patterns (Multiplicity) • Exchangeable Protons
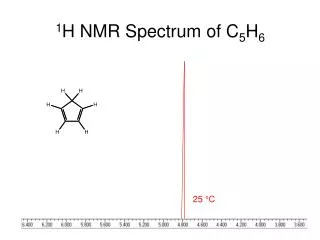
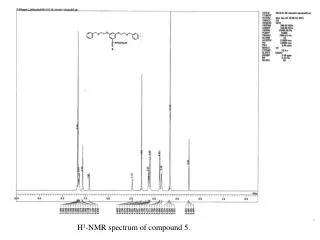
Number of Signals – Complex Cases 11 signals? 6 signals? 90 MHz spectrum: 400 MHz spectrum
Effect of Magnetic Field Strength on Spectrum Quality 60 MHz 300 MHz ppm = Hz/MHz MHz = Hz/ppm So the instrument frequency tells you how many Hz there are in 1 ppm
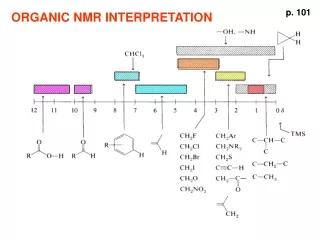
Chemical Shift Proton NMR shifts normally range from 0 ppm (TMS) to 10 ppm Inductive effects explain a lot: CHCl3 in CDCl3 = 7.26 ppm H2O in CDCl3 = 1.55 ppm
Peak Integrations • The area under an NMR signal (the integration) is proportional to the number of absorbing protons. • The area ratios tell us the ratios of the protons causing the peak. • Strategy - find a peak that you can assign unambiguously and set its integration at the appropriate number of Hs.
Splitting Patterns • Consider the spectrum below:
Peak intensities in a multiplet • Doublet – The two spin states of the proton causing splitting are nearly equally populated (because the energy difference is so small). Therefore a doublet has a peak ratio of 1:1. • Triplet - For the two Hs causing splitting there are two different ways to align one proton with B0 and one proton against B0 (ab and ab) the middle peak of the triplet is twice as intense as the two outer peaks and the peak ratio is 1:2:1.
Quartet (H signal split by 3 equivalent protons, e.g. an H on a carbon next t o a CH3)
Rules for predicting splitting patterns If Ha and Hb are not equivalent, splitting is observed when: “vicinal” “germinal” • The n+1 rule - A set of n protons splits the signal of a nearby proton into n + 1 peaks. • Equivalent protons do not split each other’s signals. • Hs bonded to O or N usually do not show splitting
The coupling constant, J, is measured in Hz and has to be the same forward and reverse!
Exchangeable Protons From http://web.mnstate.edu/marasing/CHEM429_2008/Documents/1_H_NMR_Interpretation.pdf
Solving an NMR unknown • With a given formula and NMR spectra, you can determine a molecule’s structure by a 4-step process • Calculate the degree of unsaturation or hydrogen deficiency index (HDI). • Consider the number of C- 13 NMR signals as an indication of symmetry in the molecule • Analyze the proton NMR shifts, integrations and multiplicities draw out the molecular fragments that match. • Assemble the fragments into a complete structure like puzzle pieces. Klein, Organic Chemistry 2e