Download
1 / 1
10 likes | 65 Vues
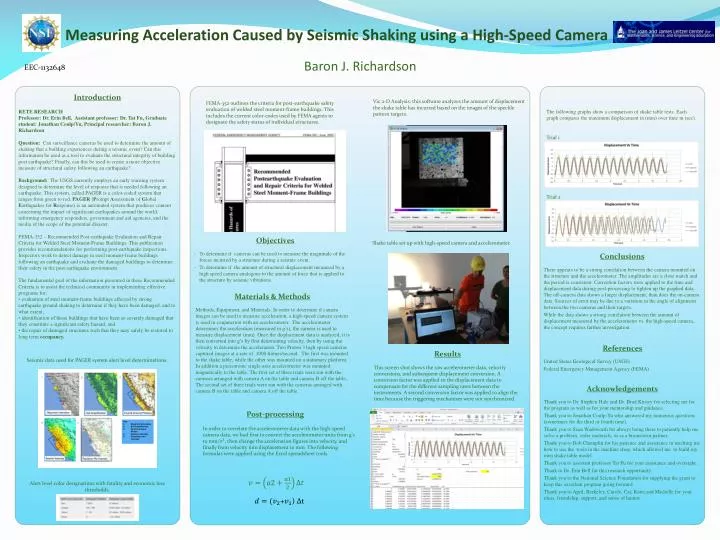
EEC-1132648. Vic 2-D Analysis: this software analyzes the amount of displacement the shake table has incurred based on the images of the speckle pattern targets.

E N D
EEC-1132648 Vic 2-D Analysis: this software analyzes the amount of displacement the shake table has incurred based on the images of the speckle pattern targets. FEMA-352 outlines the criteria for post-earthquake safety evaluation of welded steel moment-frame buildings. This includes the current color-codes used by FEMA agents to designate the safety status of individual structures. References Introduction Objectives Methods, Equipment, and Materials: In order to determine if camera images can be used to measure acceleration, a high-speed camera system is used in conjunction with an accelerometer. The accelerometer determines the acceleration (measured in g’s), the camera is used to measure displacement (mm). Once the displacement data is analyzed, it is then converted into g’s by first determining velocity, then by using the velocity to determine the acceleration. Two Proton 3 high speed cameras captured images at a rate of 1000 frames/second. The first was mounted to the shake table, while the other was mounted on a stationary platform. In addition a piezotronic single-axis accelerometer was mounted magnetically to the table. The first set of three trials were run with the cameras arranged with camera A on the table and camera B off the table., The second set of three trials were run with the cameras arranged with camera B on the table and camera A off the table. The following graphs show a comparison of shake table tests. Each graph compares the maximum displacement in (mm) over time in (sec). Results Conclusions Materials & Methods Baron J. Richardson United States Geological Survey (USGS) Federal Emergency Management Agency (FEMA) Acknowledgements There appears to be a strong correlation between the camera mounted on the structure and the accelerometer. The amplitudes are a close match and the period is consistent. Correction factors were applied to the time and displacement data during post-processing to tighten up the graphed data. The off-camera data shows a larger displacement, than does the on-camera data. Sources of error may be due to a variation in the angle of alignment between the two cameras and their targets. While the data shows a strong correlation between the amount of displacement measured by the accelerometer vs. the high-speed camera, the concept requires further investigation. Thank you to Dr. Stephen Hale and Dr. Brad Kinsey for selecting me for the program as well as for your mentorship and guidance. Thank you to Jonathan Coulp-Yu who answered my numerous questions (sometimes for the third or fourth time). Thank you to Sean Wadsworth for always being there to patiently help me solve a problem, order materials, or as a brainstorm partner. Thank you to Bob Champlin for his patience and assistance in teaching me how to use the tools in the machine shop, which allowed me to build my own shake table model. Thank you to assistant professor Tat Fu for your assistance and oversight. Thank to Dr. Erin Bell for this research opportunity. Thank you to the National Science Foundation for supplying the grant to keep this excellent program going forward. Thank you to April, Berkeley, Carole, Cat, Katie,andMichelle for your ideas, friendship, support, and sense of humor. To determine if cameras can be used to measure the magnitude of the forces incurred by a structure during a seismic event. To determine if the amount of structural displacement measured by a high speed camera analogous to the amount of force that is applied to the structure by seismic vibrations. Measuring Acceleration Caused by Seismic Shaking using a High-Speed Camera RETE RESEARCHProfessor: Dr. Erin Bell, Assistant professor: Dr. Tat Fu, Graduate student: Jonathan Coulp/Yu, Principal researcher: Baron J. RichardsonQuestion: Can surveillance cameras be used to determine the amount of shaking that a building experiences during a seismic event? Can this information be used as a tool to evaluate the structural integrity of building post earthquake? Finally, can this be used to create a more objective measure of structural safety following an earthquake?Background: The USGS currently employs an early warning system designed to determine the level of response that is needed following an earthquake. This system, called PAGER is a color-coded system that ranges from green to red. PAGER (Prompt Assessment of Global Earthquakes for Response) is an automated system that produces content concerning the impact of significant earthquakes around the world, informing emergency responders, government and aid agencies, and the media of the scope of the potential disaster. FEMA-352 – Recommended Post-earthquake Evaluation and Repair Criteria for Welded Steel Moment-Frame Buildings. This publication provides recommendations for performing post-earthquake inspections. Inspectors work to detect damage in steel moment-frame buildings following an earthquake and evaluate the damaged buildings to determine their safety in the post-earthquake environment.The fundamental goal of the information presented in these Recommended Criteria is to assist the technical community in implementing effective programs for:• evaluation of steel moment-frame buildings affected by strong earthquake ground shaking to determine if they have been damaged, and to what extent,• identification of those buildings that have been so severely damaged that they constitute a significant safety hazard, and• the repair of damaged structures such that they may safely be restored to long term occupancy. Trial 1 Trial 2 Shake table set up with high-speed camera and accelerometer. Seismic data used for PAGER system alert level determinations. This screen shot shows the raw accelerometer data, velocity conversions, and subsequent displacement conversion. A conversion factor was applied to the displacement data to compensate for the different sampling rates between the instruments. A second conversion factor was applied to align the time because the triggering mechanism were not synchronized. Post-processing Key: Reported intensities Soil Amplification Fault & Ground Motion Seismic Intensity Population Per Intensity In order to correlate the accelerometer data with the high-speed camera data, we had first to convert the accelerometer units from g’s to mm/, then change the acceleration figures into velocity, and finally from velocity into displacement in mm. The following formulas were applied using the Excel spreadsheet tools. Alert level color designations with fatality and economic loss thresholds. +) Δt