Download
1 / 1
10 likes | 116 Vues
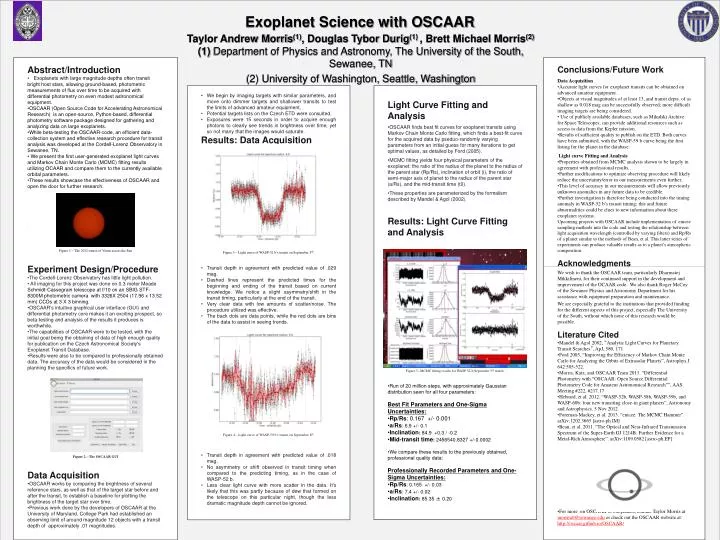
Exoplanet Science with OSCAAR. Taylor Andrew Morris (1) , Douglas Tybor Durig (1) , Brett Michael Morris (2) (1) Department of Physics and Astronomy, The University of the South, Sewanee, TN (2) University of Washington, Seattle, Washington. Abstract/Introduction

E N D
Exoplanet Science with OSCAAR Taylor Andrew Morris(1), Douglas Tybor Durig(1) , Brett Michael Morris(2)(1) Department of Physics and Astronomy, The University of the South, Sewanee, TN (2) University of Washington, Seattle, Washington • Abstract/Introduction • Exoplanets with large magnitude depths often transit bright host stars, allowing ground-based, photometric measurements of flux over time to be acquired with differential photometry on even modest astronomical equipment. • OSCAAR (Open Source Code for Accelerating Astronomical Research) is an open-source, Python-based, differential photometry software package designed for gathering and analyzing data on large exoplanets. • While beta-testing the OSCAAR-code, an efficient data-collection system and effective research procedure for transit analysis was developed at the Cordell-Lorenz Observatory in Sewanee, TN. • We present the first user-generated exoplanet light curves and Markov Chain Monte Carlo (MCMC) fitting results utilizing OCAAR and compare them to the currently available orbital parameters. • These results showcase the effectiveness of OSCAAR and open the door for further research. • . • Figure 1—The 2012 transit of Venus across the Sun • Experiment Design/Procedure • The Cordell-Lorenz Observatory has little light pollution. • All imaging for this project was done on 0.3 meter Meade Schmidt-Cassegrain telescope at f/10 on an SBIG STF-8300M photometric camera with 3326X 2504 (17.96 x 13.52 mm) CCDs at 3 X 3 binning. • OSCAAR’s intuitive graphical user interface (GUI) and differential photometry core makes it an exciting prospect, so beta-testing and analysis of the results it produces is worthwhile. • The capabilities of OSCAAR were to be tested, with the initial goal being the obtaining of data of high enough quality for publication on the Czech Astronomical Society's Exoplanet Transit Database. • Results were also to be compared to professionally obtained data. The accuracy of the data would be considered in the planning the specifics of future work. • Figure 2—The OSCAAR GUI • Data Acquisition • OSCAAR works by comparing the brightness of several reference stars, as well as that of the target star before and after the transit, to establish a baseline for plotting the brightness of the target star over time. • Previous work done by the developers of OSCAAR at the University of Maryland, College Park had established an observing limit of around magnitude 12 objects with a transit depth of approximately .01 magnitudes. • Conclusions/Future Work • Data Acquisition • Accurate light curves for exoplanet transits can be obtained on advanced amateur equipment. • Objects at visual magnitudes of at least 13, and transit depts. of as shallow as 0.018 mag can be successfully observed; more difficult imaging targets are being considered. • Use of publicly available databases, such as Mikulski Archive for Space Telescopes, can provide additional resources such as access to data from the Kepler mission. • Results of sufficient quality to publish on the ETD. Both curves have been submitted, with the WASP-59 b curve being the first listing for the planet in the database. • Light curve Fitting and Analysis • Properties obtained from MCMC analysis shown to be largely in agreement with professional results. • Further modifications to optimize observing procedure will likely reduce the uncertainty/error in our measurements even further. • This level of accuracy in our measurements will allow previously unknown anomalies in any future data to be credible. • Further investigation is therefore being conducted into the timing anomaly in WASP-52 b’s transit timing; this and future abnormalities could be clues to new information about these exoplanet systems. • Upcoming projects with OSCAAR include implementation of emcee sampling methods into the code and testing the relationship between light acquisition wavelength (controlled by varying filters) and Rp/Rsof a planet similar to the methods of Bean, et al. This latter series of experiments can produce valuable results as to a planet’s atmospheric composition. • Acknowledgments • We wish to thank the OSCAAR team, particularly Dharmatej Mikkilineni, for their continued support in the development and improvement of the OCAAR code. We also thank Roger McCoy of the Sewanee Physics and Astronomy Department for his assistance with equipment preparation and maintenance. • We are especially grateful to the institutions that provided funding for the different aspects of this project, especially The University of the South, without which none of this research would be possible. • Literature Cited • Mandel & Agol 2002, “Analytic Light Curves for Planetary Transit Searches”, ApJ, 580, 171 • Ford 2005, “Improving the Efficiency of Markov Chain Monte Carlo for Analyzing the Orbits of Extrasolar Planets”, Astrophys.J. 642:505-522. • Morris, Katz, and OSCAAR Team 2013. “Differential Photometry with “OSCAAR: Open Source Differential Photometry Code for Amateur Astronomical Research””, AAS Meeting #222, #217.17 • Hebrard, et al. 2012. “WASP-52b, WASP-58b, WASP-59b, and WASP-60b: four new transiting close-in giant planets”, Astronomy and Astrophysics. 5 Nov 2012. • Foreman-Mackey, et al. 2013. “emcee: The MCMC Hammer”. arXiv:1202.3665[astro-ph.IM] • Bean, et al. 2011. “The Optical and Near-Infrared Transmission Spectrum of the Super-Earth GJ 1214B: Further Evidence for a Metal-Rich Atmosphere”. arXiv:1109.0582 [astro-ph.EP] • For more on OSCAAR or exoplanets, contact Taylor Morris at morrita0@sewanee.edu or check out the OSCAAR website at: http://oscaar.github.io/OSCAAR/ • Light Curve Fitting and Analysis • OSCAAR finds best fit curves for exoplanet transits using Markov Chain Monte Carlo fitting, which finds a best-fit curve for the acquired data by pseduo-randomly varying parameters from an initial guess for many iterations to get optimal values, as detailed by Ford (2005). • MCMC fitting yields four physical parameters of the exoplanet: the ratio of the radius of the planet to the radius of the parent star (Rp/Rs), inclination of orbit (i), the ratio of semi-major axis of planet to the radius of the parent star (a/Rs), and the mid-transit time (t0). • These properties are parameterized by the formalism described by Mandel & Agol (2002). • Results: Light Curve Fitting and Analysis • Figure 5--MCMC fitting results for WASP 52-b September 5th transit: • Run of 20 million steps, with approximately Gaussian distribution seen for all four parameters: • Best Fit Parameters and One-Sigma Uncertainties: • Rp/Rs: 0.167 +/- 0.001 • a/Rs: 6.9 +/- 0.1 • Inclination: 84.9 +0.3 / -0.2 • Mid-transit time: 2456540.8327 +/-0.0002 • We compare these results to the previously obtained, professional quality data: • Professionally Recorded Parameters and One-Sigma Uncertainties: • Rp/Rs: 0.165 +/- 0.03 • a/Rs: 7.4 +/- 0.02 • Inclination: 85.35 ± 0.20 • We begin by imaging targets with similar parameters, and move onto dimmer targets and shallower transits to test the limits of advanced amateur equipment. • Potential targets lists on the Czech ETD were consulted. • Exposures were 15 seconds in order to acquire enough photons to clearly see trends in brightness over time, yet so not many that the images would saturate. • Results: Data Acquisition • Figure 3—Light curve of WASP-52 b’s transit on September 5th: • Transit depth in agreement with predicted value of .029 mag. • Dashed lines represent the predicted times for the beginning and ending of the transit based on current knowledge. We notice a slight asymmetry/shift in the transit timing, particularly at the end of the transit. • Very clear data with low amounts of scatter/noise. The procedure utilized was effective. • The back dots are data points, while the red dots are bins of the data to assist in seeing trends. • Figure 4—Light curve of WASP-59 b’s transit on September 8th: • Transit depth in agreement with predicted value of .018 mag. • No asymmetry or shift observed in transit timing when compared to the predicting timing, as in the case of WASP-52 b. • Less clear light curve with more scatter in the data. It’s likely that this was partly because of dew that formed on the telescope on this particular night, though the less dramatic magnitude depth cannot be ignored.