Download
1 / 55
550 likes | 683 Vues
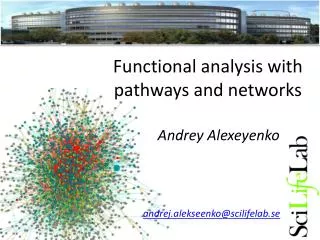
Gene interaction networks for functional analysis and prognostication. Andrey Alexeyenko. “Data is not information, information is not knowledge , knowledge is not wisdom, wisdom is not truth,” — Robert Royar (1994 ). Biological data production. http://www.hdpaperz.com.

E N D
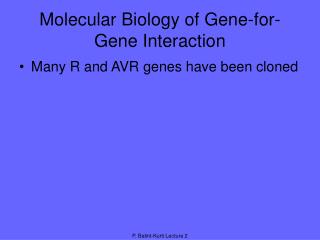
Gene interaction networks for functional analysis and prognostication AndreyAlexeyenko
“Data is not information, information is not knowledge, knowledge is not wisdom, wisdom is not truth,” —Robert Royar (1994)
Biological data production http://www.hdpaperz.com …and analysis
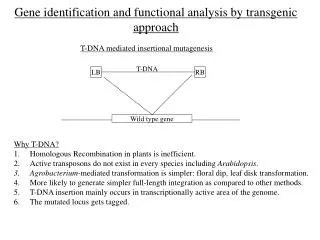
Amouse ? Human High-throughput evidence Rat Find orthologs* Bmouse Fly Yeast FunCoup is a data integration framework to discover functional coupling in eukaryotic proteomes with data from model organisms Andrey Alexeyenkoand Erik L.L. Sonnhammer (2009) Global networks of functional coupling in eukaryotes from comprehensive data integration.Genome Research.
FunCoup • Each piece of data isevaluated • Data FROM many eukaryotes (7) • Practical maximum of data sources (>50) • Predicted networks FOR a number of eukaryotes (10…) • Organism-specific efficient and robust Bayesian frameworks • Orthology-based information transfer and phylogenetic profiling • Networks predicted for different types of functional coupling (metabolic, signaling etc.)
FunCoup: on-line interactome resource http://FunCoup.sbc.su.se Andrey Alexeyenkoand Erik L.L. Sonnhammer (2009) Global networks of functional coupling in eukaryotes from comprehensive data integration.Genome Research.
State-of-the-art method to beat: Frequency analysis of somatic mutations Do gene networks tell any story? • Yellow diamonds: somatic mutations in prostate cancer • Pink crosses: also mutated in glioblastome (TCGA)
Network enrichment analysis: Question: How to find something in common between many altered genes? Altered genes (green) from one individual lung cancer are enriched in network connections to members of ErbB (HER2) pathway (yellow) and GO term “apoptosis” (blue).
Apophenia: the human propensity to see meaningful patterns in random data (Brugger 2001; Fyfe et al. 2008)
Confidence of biological observations: Looks “interesting”… Statistically significant (individually) Statistically significant (adjusted for multiple testing) Functionally relevant: THE CORE
PLoS Med 2005 2(8):e124 • Dimensionality curse: many variables and few observations, while causative events are rare. • Tradition not to publish negative results. • Acceptance of a common p-value threshold without adjustment for multiple testing (a hundred papers with single experiment in each is multiple testing!..).
Even a cohort of 250.000 individuals with 2.800.000 SNPs could only explain less than 4% of variability of the body mass index (the total heritability had been estimated as 40-70%). The authors extrapolate that 730.000 individuals would explain around 5% of the observed variance). From Speliotes et al. 2010: Genome-wide association results for the body mass index, meta-analysis (a) Manhattan plot showing the significance of association between all SNPs and BMI in the stage 1 meta-analysis, highlighting SNPs previously reported to show genome-wide significant association with BMI (blue), weight or waist circumference (green), and the 18 new regions described here (red). The 19 SNPs that reached genome-wide significance at Stage 1 (13 previously reported and 6 new) are listed in Table 1). (b) Quantile-quantile (Q-Q) plot of SNPs in stage 1 meta-analysis (black) and after removing any SNPs within 1 Mb of the 10 previously reported genome-wide significant hits for BMI (blue), after additionally excluding SNPs from the four loci for waist/weight (green) and after excluding SNPs from all 32 confirmed loci (red). The plot was abridged at the Y-axis (at P < 10−20) to better visualise the excess of small P-values after excluding the 32 confirmed loci (Supplementary Fig. 3 shows full-scale Q-Q plot). The shaded region is the 95% concentration band. (c) Plot of effect size (in inverse normally transformed units (invBMI)) versus effect allele frequency of newly identified and previously identified BMI variants after stage 1 + stage 2 analysis; including the 10 previously identified BMI loci (blue), the four previously identified waist and weight loci (green) and the 18 newly identified BMI loci (blue). The dotted lines represent the minimum effect sizes that could be identified for a given effect-allele frequency with 80% (upper line), 50% (middle line), and 10% (lower line) power, assuming a sample size of 123,000 individuals and a α-level of 5×10⁻⁸.
Yuri Lazebnik, 2002 …………………………………………………………………………………………………………………………
How does it still work? • “The hyperbrain”. Scientific community critically evaluates each finding, most commonly rejects it… • In reality, scientists do notwhat they promise in grant applications. • Scientific data is used not what it was meant for. • Common sense still rules. • Answering simple questions does the job.
Network enrichment analysis: Question: How to find something in common between many altered genes? Altered genes (green) from one individual lung cancer are enriched in network connections to members of ErbB (HER2) pathway (yellow) and GO term “apoptosis” (blue).
Network enrichment analysis: compared to a reference and quantified Actual network: observed pattern A random pattern N links_real= 12 N links_expected = 4.65 Question: Is ANXA2 related to TGFbeta signaling? Standard deviation = 1.84 Z = (N links_observed – N links_expected) / SD = 3.98 P-value = 0.0000344 FDR < 0.1
Functional characterization of novel gene sets State-of-the-art method to beat: Gene set enrichment analysis Our alternative: Network enrichment analysis Altered genes Functional set ? Alexeyenko A, Lee W, … PawitanY. Network enrichment analysis: extension of gene-set enrichment analysis to gene networks. BMC Bioinformatics, 2012
Pathway analysis: why needed, what it is? Primary molecular processes Response, recorded with high-throughput paltforms Known biological units: processes, pathways Protein abundance … N. Phosphorylation … N. Methylation … N. mRNA expression … N. ChipSeq … N. Mutation profile … N. Metabolites … N.
Towards even better network predictionpartial correlations:a way to get rid of spurious links 0.7 0.6 0.4
Cancer-specific networks:links inferred from expression, methylation, mutations Functional coupling transcription transcription transcription methylation methylation methylation mutation methylation mutation transcription mutation mutation + mutated gene State-of-the-art method to beat: Reverse engeneeringfroma single source (usually transcriptome)
Molecular phenotypes in network space(lung cancer, data from ChemoRes consortium) P53 signaling Apoptosis Question: How to distinguish between different molecular subtypes of cancer? Cell cycle
Somatic mutations: drivers vs. passengersdata from The Cancer Genome Atlas
Driver copy number changes Confidence Copy number Gains and losses on chromosome 7, in 142 glioblastomamultiforme genomes, TCGA
Validation of candidate disease genes(work with Jonathan Prince, MEB, KI) Genetic association of sequence variants near AGER/NOTCH4 and dementia. Bennet AM, Reynolds CA, Eriksson UK, Hong MG, Blennow K, Gatz M, Alexeyenko A, Pedersen NL, Prince JA. J Alzheimers Dis. 2011;24(3):475-84. Genome-wide pathway analysis implicates intracellular transmembrane protein transport in Alzheimer disease. Hong MG, Alexeyenko A, Lambert JC, Amouyel P, Prince JA. J Hum Genet. 2010 Oct;55(10):707-9. Epub 2010 Jul 29. Analysis of lipid pathway genes indicates association of sequence variation near SREBF1/TOM1L2/ATPAF2 with dementia risk. Reynolds CA, Hong MG, Eriksson UK, Blennow K, Wiklund F, Johansson B, Malmberg B, Berg S, Alexeyenko A, Grönberg H, Gatz M, Pedersen NL, Prince JA. Hum Mol Genet. 2010 May 15;19(10):2068-78. Epub 2010 Feb 18. Question: Is there extra evidence for GWAS-candidates to be involved? Answer: Yes, for some…
Resistance to vinorelbine in lung cancer Question: What predicts tumor resistance to chemotherapy? Answer: Depletion of differential transcriptome towards few specific genes
Resistance to vinorelbine in lung cancer Functionally coherent genes associated with vinorelbine resistance. A. Network representation of the group. Magenta: genes associated with resistance in NEA and likely producing a protein complex (ranked 1, 3, 5, 6, 11, and 18) plus one more gene CLPTM1L (beyond the ranking but also significantly associated, was previously reported as related to cisplatin resistance); yellow: non-commonly expressed genes linked with the NEA genes and less represented in the susceptible tumors, hence most contributing to the association (see Results for more explanation). B. Box-plots of NEA scores for the genes colored magenta in A.
Clinical data, e.g.: Estrogen receptor status: +/ – Lymph. node status: 0,1,2,3 Relapse : yes/no and time (days) × Expression: ~20000 genes Procedure for gene X phenotype signatures RELAPSE = γ0P+ γ1g1+ γ2g2 + γ3g3 + … + γNgN
Overlap between gene signatures of relapse • Usually the overlap between signatures is negligible. Because e.g.: • Different sub-types of patient population, • Different microarray platforms! From Roepman et al., 2007 However the main reason is: Dimensionality curse!
Biomarker discovery in network context • The idea: • Construct multi-gene predictors with regard to network context • Reduce the computational complexity • Make marker sets biologically sound • Accounting for network context is taking either: • network neighbors or • genes at remote network positions
Ready signature in the network RELAPSE = γ1EIF3S9+ γ2CRHR1+ γ3LYN+ … + γNKCNA5
Chemotoxicity in lung cancer treatment(work with J. Hasmats, H. Green, J. Lundeberg) High toxicity Low toxicity 1240 1254 1424 1536 287 664 801 812 1066 1197 1214 172 237 264 400 732 Z-score FAM13A 0 0 0 0 0 0 0 0 1 0 1 1 1 1 1 1 -2.61 HEPACAM 0 0 0 1 0 0 1 0 1 1 1 1 1 1 1 1 -2.32 OR8J1 0 1 0 0 0 0 1 0 1 1 1 1 1 1 1 1 -2.32 ARGFX 0 1 0 0 0 0 1 0 0 1 1 1 1 1 1 1 -2.26 DZIP1 1 0 0 0 0 0 0 0 1 1 0 1 1 1 0 1 -2.26 GABRR2 0 0 0 0 1 1 0 0 1 1 1 0 1 1 1 1 -2.26 LIPC 0 0 0 0 0 0 0 1 1 1 1 0 1 1 1 0 -2.26 MADD 0 0 0 0 1 0 0 0 1 0 1 1 1 1 0 1 -2.26 MMP27 0 1 1 0 0 0 0 0 1 0 1 1 1 1 1 1 -2.26 MMP8 0 0 0 1 0 0 1 0 1 1 0 1 1 1 1 1 -2.26 PI3 0 0 1 0 0 0 1 0 1 1 1 1 1 1 1 0 -2.26 SCGB1D2 0 0 0 0 0 0 0 1 1 0 1 1 1 1 1 0 -2.26 SCLY 0 1 1 1 1 1 1 1 0 1 0 0 0 0 0 1 2.26 SCN11A 0 1 0 0 0 0 0 0 1 1 1 0 0 1 1 1 -2.26 VPS13B 0 0 0 1 0 0 0 0 1 1 1 1 1 0 0 1 -2.26 APOC4 0 0 1 0 1 0 1 0 1 1 1 1 1 1 1 1 -2.01 DNAH3 0 1 1 1 0 0 0 0 1 1 1 1 1 1 1 1 -2.01 NID1 0 0 0 0 0 0 0 0 0 1 1 1 1 0 1 0 -2.01 OR10P1 1 1 1 1 1 1 1 1 1 0 0 1 0 0 1 0 2.01 OR4D11 0 0 0 0 0 0 0 0 0 1 1 0 0 1 1 1 -2.01 PAPPA 1 0 0 1 1 0 0 0 1 1 1 1 1 1 1 1 -2.01 PGM3 0 0 0 0 0 0 0 0 1 0 0 1 1 1 0 1 -2.01 SLC22A4 0 1 1 0 0 0 0 1 1 1 1 1 1 1 1 1 -2.01 WDR52 0 0 0 0 0 0 0 0 1 1 1 1 1 0 0 0 -2.01 ZNF445 0 0 0 0 0 0 0 0 0 1 0 1 1 1 1 0 -2.01 ACTL8 1 1 1 0 1 0 1 1 0 0 0 0 1 0 1 0 1.90 ADAMDEC1 0 1 0 0 1 0 0 1 1 0 1 1 1 1 1 1 -1.90 BAT2L2 0 0 0 0 1 0 0 0 0 0 1 1 1 1 0 1 -1.90 BRCA1 0 0 1 1 0 0 0 0 1 1 1 1 1 0 1 0 -1.90 Question: Are there any high-order interactions between toxicity-associated variants? Answer: … With the set of 16 patients, there was not enough statistical power to detect toxicity-associated alleles individually (only 1 gene had a p-value <0.01)
Enrichment of intra-connectivity of sets of genes with contrast variants over “Low/High” Neg: variant prevalent in “Low”; Pos: variant prevalent in “High”; Top: Union of Pos & Neg; Rnd: Same size of gene set a s in Top, but test z-score of sign ignored NULL: Same size of gene set as in Pos, Neg, Top, Rnd, but genes are replaced with random network genes
Mutations accumulated in somatic genomes of cancer cell lines(Pelin Akan et al., Genome Medicine 2012) Question: Do mutations within a cancer genome behave like a quasi-pathway? Answer: Yes. Question: How similar are mutation patterns in different cancers? Answer: A lot, but only for drivers and at the pathway level.
Experimental perturbations of syndecan-1 in cancer cells(T. Szatmari et al., PLoS One, 2012) Question: Second-order downstream targets of syndecan modulation? Answer: Segments of cell cycle etc. Lines: Red: depletion Blue: enrichment
Decomposing biological context Develomental rPLC = 0.95 Common rPLC = 0.88 ANOVA (Analysis Of VAriance): Look at F-ratios: Signal of interest / Residual (“error”) variance Dioxin-enabled rPLC = 0.76
Accounting for edge features:dioxin-enabled vs. dioxin-sensitive links Andrey Alexeyenko, Deena M Wassenberg, Edward K Lobenhofer, Jerry Yen, Erik LL Sonnhammer, Elwood Linney, Joel N Meyer Transcriptional response to dioxin in the interactome of developing zebrafish. submitted.
Network analysis:how to succeed? • Analyze prioritized candidates (from genotyping, DE, GWAS…) rather than any genes. • Do not lean on single “interesting” network links. Employ statistics! i.e. “concrete questions” => “testable hypotheses” => “concrete answers” The amount of information in known gene networks is enormous. Let’s just use it!
Acknowledgements • Simon Merid • AshwiniJeggari • Darya Goranskaya • Pan Lu • Erik Sonnhammer • Martin Klammer • SanjitRoopra • Ted McCormack • Oliver Frings • Jonathan Prince • YudiPawitan • SetiaPramana • WooJoo Lee • Joakim Lundeberg • Pelin Akan • IngemarErnberg • Per Kraulis
Network enrichment analysis: applications State-of-the-art method to beat: Observational science Pathway characterization Detection of driver mutations Coherence of genome alterations Question: Could copy number alteration in EHR in HOU501106 lead to changes of its transcriptome and proteome? Question: Does gene expression in MAT230414 relate to “response to tumor cell”? Question: Are CNA in HOU501106 coherent? N links_real= 6 N links_real= 55 N links_real= 0 N links_expected = 1.00 N links_expected = 37.05 N links_expected = 1.05 Standard deviation = 1.25 Standard deviation = 3.59 Standard deviation = 0.80 Z = 3.97 Z = 3.59 Z = -1.31 P-value = 0.0000356 P-value = 0.00016 P-value = 0.905
Pathway view on the set of toxicity-associated alleles Red node: list of top 50 genes with most contrast allele patterns Grey node: negative control list Yellow: enriched/depleted pathways Edge width: no. of gene-gene links in the network Edge opacity: confidence Green edges: enrichment Red edges: depletion Edges produced by less than 3 list genes are not shown0 The analysis detected more significantly enriched pathways than for the negative control gene sets of the same size (215 vs. 139; p0 < 0.001; FDR<0.05). More specifically, many thus found pathways were associated with cancer, apoptosis, cell division etc.