Download
1 / 23
230 likes | 348 Vues
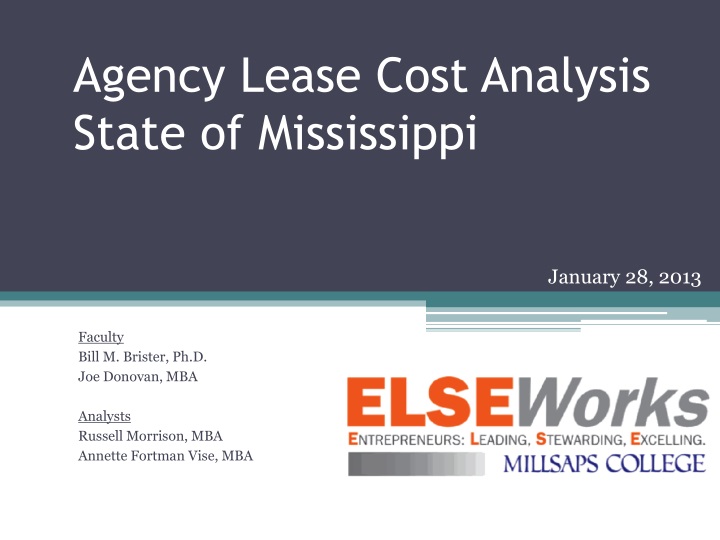
Agency Lease Cost Analysis State of Mississippi. January 28, 2013. Faculty Bill M. Brister, Ph.D. Joe Donovan, MBA Analysts Russell Morrison, MBA Annette Fortman Vise, MBA.

E N D
Agency Lease Cost AnalysisState of Mississippi January 28, 2013 Faculty Bill M. Brister, Ph.D. Joe Donovan, MBA Analysts Russell Morrison, MBA Annette Fortman Vise, MBA
Contents:1. Lease Cost Comparisons Within Metro Area2. Office Space Allocation and Efficiency3. Revisit Purchase of Landmark Center
State Agency Offices Eligible to Move The State Capitol Building is located in the center of the map.
1Comparing the Costs of Leasing Office Space in the Metro Jackson Area
Summary of Property Leases in Tri-County Area Source: Department of Finance and Administration
Office Leases in Tri-County Area Of the 59 Office Leases, 4 are leases between State agencies, leaving 55 Office Leases between State agency and private sector. Source: Department of Finance and Administration
Agencies Located Outside of Capitol Complex(Does not include satellite offices, e.g. WIC, Medicaid, etc. Source: Department of Finance and Administration
State Agency Leases Downtown Source: Department of Finance and Administration
Lease Cost of Select Vacant Buildings Downtown * Cushman and Wakefield, 2011 ** Stated to ELSEWorks ***DFA Pays $12.50 and State Personnel Board pays $12.19.
Finding: The lease rates for the vacant office space presented previously in Downtown Jackson are slightly lower than lease rates currently being paid by State agencies in the Metro Area, even with no agencies sharing space.
Federal Benchmark for Office Space Allocation The current benchmark for office workspace of the U.S. General Services Administration (GSA) is 218 Rentable Square Feet per person, which includes all individual and shared space such as workstations, circulation, storage, and conference rooms. How one allots space among the different uses is up to the organization, working with their staff, management, and designers. The 218 rentable square feet per person was determined by benchmarking public and private sector office space users.
Rentable Square Feet (RSF) per Person Comparisons • Virginia Implemented a standard average 222 RSF per person • Texas Currently averages 225 RSF per person down from 236 RSF since 2000 • Mississippi Currently averages 323 RSF per person, approximately 46% more than VA and 44% more than TX
Savings From Reducing Space Utilization Rates • A reduction in the space per person from the current 323 square feet in Mississippi to the Federal benchmark of 218 square feet represents a 33% reduction in leased office space. • The State currently spends $15.5 million per year (statewide) on leased office space. Reducing this amount by 33% through more efficient use of space would save over $5 million per year.
Findings: The State of Mississippi current leases significantly more office space per person than is recommended by the U.S. General Services Administration and has been achieved by other states such as Texas and Virginia. The State can realize significant savings by reducing the rentable square feet per person in State agency leases.
Recommendations to Achieve Reduction in Rentable Square Feet (RSF) per Employee • Then State should set goals and targets for reduction in RSF per employee. • Centralize authority within DFA to oversee the leasing process and reduce the RSF per employee. • Enable and encourage sharing spaces like conference rooms and hearing rooms through consolidating State agencies within the Capitol Complex.
345,335 SF of office space The Landmark Center September 16, 2011, Purchase Price = $14.1 million. “After careful consideration of the proposals received, we recommend the Landmark Center as the best [alternative] for the new DOR offices…” –State of Mississippi Department of Revenue, Site Selection Study, Cushman and Wakefield, September 16, 2011. NOW…ABOUT A YEAR LATER Purchase Price = $7.6 million. Photo by Ted Carter Conclusion: Holding the assumptions in the Cushman and Wakefield study constant except for the price, a purchase of the Landmark Center is an even better deal today than it was a year ago, when it was deemed the best alternative for housing DOR.
Purchase Landmark Center vs. Continued Leasing for State Agencies Assumptions: • Purchase Price for Landmark Center = $7.6 million • All other assumptions from Cushman and Wakefield report hold, including: Cost of Tenant Improvements = $40 per SF. Operating Expenses = $6.00 per SF. Recurring Capital Improvements = $1.00 per SF. Parking Expense = $1.14 per SF. • Current lease rates paid by State agencies in metro area (average of $14.33 per SF) escalate by 2% annually. • The DOR requires 209,000 SF. Other state agencies in the metro area but outside of the Capitol Complex currently lease 176,200 SF. This totals 385,200 SF, which is more than enough to fill up the Landmark Center.
Savings from Purchase of Landmark Center vs. Continued Leasing for State Agencies Additionally, the State will own the Landmark Center free and clear after 20 years with the Purchase Option. Not so with the Lease Option.
Finding: Purchasing the Landmark Center and filling it with State agencies (which now lease office space in the metro area) provides the State an opportunity to achieve significant savings in the annual cost of office space.
Summary of Findings • The average lease rate for the vacant office space examined in downtown Jackson is slightly lower than the average lease rate currently being paid by State agencies outside of downtown Jackson, but within the metro area. • Significant savings can be realized through more efficient use of office space by State agencies. • Purchasing the Landmark Center and filling it with State agencies (which now lease office space in the metro area) affords the State significant cost savings.
Sources Cushman and Wakefield Study, 2011. General Services Administration; Office of Governmentwide Policy; Office of Real Property Management; Performance Measurement Division. “Workspace Utilization and Allocation Benchmark” July 2011. Hood, Mason. Department of General Services for the Commonwealth of Virginia; Division of Real Estate Services, January 2013. Mississippi Department of Finance and Administration, 2012. Texas Facilities Commission Master Plan, 2011.