Download
1 / 24
240 likes | 345 Vues
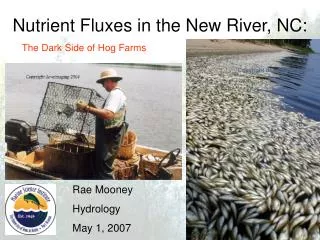
Nutrient Trends in Selected Springs of the Santa Fe River. Robbie McKinney Environmental Scientist-Biologist Santa Fe Springs Working Group December 11, 2008. Background. Water Assessment Regional Network Established 1989 water quality status changing conditions

E N D
Nutrient Trends in Selected Springs of the Santa Fe River Robbie McKinney Environmental Scientist-Biologist Santa Fe Springs Working Group December 11, 2008
Background • Water Assessment Regional Network • Established 1989 • water quality status • changing conditions • Over 10 years of data collection • Springs • Rivers • Lakes
SRWMD Spring Sampling Sites • Poe Springs – June 1997 * • Ginnie Springs – November 1997 • Blue Springs (High Springs) – December 1992 * • Columbia Springs – May 1998 • Treehouse Springs – May 1998 • Hornsby Springs – November 1992 * • Santa Fe Springs – June 1998 *monitored monthly; included in presentation
Statistical Analyses • Data analysis includes • Date collected • Year collected • Means comparisons • Spearman Rho Correlations • Split-plot Analysis of Variance (ANOVA)
Blue Springs at High Springs • Gilchrist County • Blue Springs Park • Second Magnitude • 40 foot diameter vent • Max. depth is 24 ft. • Approx. 2000 ft. spring run
2007-2008 Nutrient Sample Data **Correlation between Date, Year, and NOX** **No TP correlation with Date, Year**
Period of Record NOX Trends r = 0.489 p < 0.001
NOX Trends by Year r = 0.488 p < 0.001
Poe Springs • Alachua County • Poe Springs County Park • Second Magnitude • Approx. 150 ft. pool area • Max depth is 18 ft. • 60 ft. spring run
2007-2008 Nutrient Sample Data **Correlation between Date, Year, and NOX** **No TP correlation with Date, Year**
Period of Record NOX Trends r = -0.690 p < 0.001
NOX Trends by Year r = -0.688 p < 0.001
Hornsby Springs • Alachua County • Camp Kulaqua • Second Magnitude • Pool is approx. 300 ft • Max. depth is 20 ft. • 35 ft. diameter vents • 0.8 mile spring run
2007-2008 Nutrient Sample Data **Correlation between Date, Year, and NOX** **No TP correlation with Date, Year**
Period of Record NOX Trends r = -0.499 p < 0.001
NOX Trends by Year r = -0.493 p < 0.001
Nitrate-Nitrite Nitrogen by Site A p<0.0001 B C 0.345 1.718 0.534
Nitrate-Nitrite Nitrogen by Year No Significant Differences p=0.0857 Value Range 0.600 – 1.349
Total Phosphorus by Site A A p<0.0001 B 0.102 0.046 0.099
Total Phosphorus by Year A A AB AB AB AB p=0.0009 AB AB AB AB AB AB AB AB AB AB B A = 0.097 B = 0.066
References Boyd, C. E. 2000. Water quality: an introduction. Kluwer Academic Publishers. Norwell, MA. 330 pp. Hornsby, D., R. Ceryak. 1998. Springs of the Suwannee River basin. Suwannee River Water Management District. Live Oak, FL. 183 pp. Hornsby, D., R. A. Mattson, and T. Mirti. 1998. Surfacewater quality and biological annual report. Suwannee River Water Management District. Live Oak, FL. 148 pp. Hornsby, D., R. A. Mattson, and T. Mirti. 2000. Surfacewater quality and biological annual report. Suwannee River Water Management District. Live Oak, FL. 234 pp. Maceina, M. J., P. W. Bettoli, and D. R. DeVries. 1994. Use of a split-plot analysis of variance design for repeated-measures fishery data. Fisheries 19(3): 14-20. SAS Institute Inc. SAS version 8.2 for Windows. Cary, NC: SAS Institute Inc. 1998-2001. SPSS, Inc. SPSS Statistics 17.0. Chicago, IL: SPSS, Inc. 2008
Contact information Robbie McKinney, M.S. Environmental Scientist-Biologist Suwannee River Water Management District 9225 County Road 49 Live Oak, FL 32060 386.362.1001 800.226.1066 RLM@SRWMD.ORG