Download
1 / 38
380 likes | 482 Vues
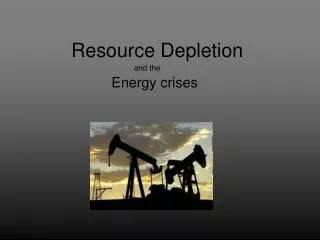
RESOURCE DEPLETION AND THE LONG-RUN AVAILABILITY OF MINERAL COMMODITIES. John E. Tilton Colorado School of Mines and Pontificia Universidad Católica de Chile Email: jtilton@mines.edu Birkbeck, University of London October 17, 2012. PURPOSE & SCOPE.

E N D
RESOURCE DEPLETION AND THELONG-RUN AVAILABILITY OF MINERAL COMMODITIES John E. Tilton Colorado School of Mines and Pontificia Universidad Católica de Chile Email: jtilton@mines.edu Birkbeck, University of London October 17, 2012
PURPOSE & SCOPE Explore the threat of depletion to the long-run availability of mineral commodities Mostly conceptual. Few definitive forecasts Focus on depletion alone and not other threats
OVERVIEW Nature & perceptions of depletion Cumulative availability curve Petroleum Lithium Conclusions and implications
I. NATURE OF DEPLETION:TWO COMMON VIEWS The fixed stock paradigm The opportunity cost paradigm
Fixed Stock ParadigmLogic Earth is finite So supply of any mineral commodity must be a fixed stock Demand is a flow variable Depletion inevitable Interesting question: life expectancies of available supply
Copper and Petroleum Life Expectancies at Current Use(years)
Fixed Stock ParadigmShortcomings • Recycling • Substitution and backstop technologies • Life expectancies at current rate of use of resource base can exceed millions of years • Rising costs will cause economic depletion long before actual physical depletion
Opportunity Cost ParadigmLogic • What really matters: the sacrifice society must make for more of a mineral commodity • Long-run trends in real prices is the most common measure used to reflect trends in opportunity costs
Opportunity Cost ParadigmDeterminants of Price • Depletion pushes prices up • New technology and innovation push them down • The future – race between the two • The past – many available studies
Real Price Trends for Aluminum, Copper, Nickel, and Zinc, 1900-2011(Five-Year Average, 1900=1)
Opportunity Cost ParadigmShortcomings of Price • Factors other than depletion affect prices (mostly in short run) • Environmental and other external costs (levels vs trends) • Future prices unknown
Opportunity Cost Versus Fixed Stock Paradigms • Despite the problems with price, opportunity cost paradigm more useful way of assessing the threat of depletion
Implications for Depletion • Scarcity not inevitable: A race between the cost-increasing effects of depletion and the cost-reducing effects of new technology • Availability can increase over time, and has in the past for some mineral goods • Threat is economic depletion - higher costs and prices curtailing demand - not physical depletion
Implications for Depletion 4. Probably not a surprise, time to respond 5. Focus on cost and price trends, not life expectancies
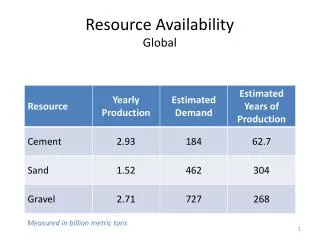
Shows total quantity available at various prices over all time Scarcity (measured by costs and prices) depends on: Movement up curve Shifts in curve Slope and shape of curve USBM efforts in 1970s and 1980s CAC is not a traditional supply curve III. CUMULATIVE AVAILABILITY CURVE Price and costs Cumulative primary output
Other More Troubling Shapes Price and costs Price and costs Cumulative primary output Cumulative primary output
Copper and the Skinner Hypothesis Unimodal Bimodal Amount of metal available at a given grade Amount of metal available at a given grade Grade Grade Source: Skinner (1976)
Common rocks 107 Energy, BTU/lb of copper The mineralogical barrier 106 105 Sulfide ores 104 0.001 0.01 0.1 1 10 Ore grade, %Cu Copper and the Skinner Hypothesis Source: Skinner (1976)
Another Cause of Jumps in CAC Demand exceeds byproduct supply requiring much more costly main product production
Three CAC Benefits Useful expository device Calls into question some common beliefs Can provide useful insights into the threat of depletion
1. Useful Expository Device Shape of the curve Nature and incidence of mineralization Other geologic factors Movement up the curve Growth in metal consumption (consumer preferences, conservation, material substitution) Recycling Shifts in the curve Changes in input costs Cost-reducing technological change
2. Questions Some Common Beliefs Population growth Renewable resources Resource use in developed countries
When shape of CAC is benign – depletion is not a problem When shape is not benign – depletion may or may not be a threat Requires actual estimation of CAC 3. Assessing the FutureThreat of Depletion Price and costs Cumulative primary output
IV. PETROLEUM Roberto F. Aguilera and others, 2009. “Depletion and future availability of petroleum resources,” Energy Journal, Vol. 30, No. 1, pp. 141-174
Approach Extends two USGS studies – National Oil and Gas Assessment (1995) and World Petroleum Assessment (2000) Estimates resources from Unassessed provinces (using a Variable Shape Distribution model) Future reserve growth Unconventional sources of liquids (heavy oil, oil sands, and oil shale) Estimates production costs Many explicit assumptions
Findings Quantity of conventional petroleum greater than often assumed Use of unconventional petroleum does not cause a big jump in CAC Price not likely to rise sharply in near future due to depletion Hard landing unlikely even if conventional oil production peaks
V. LITHIUM Andrés Yaksic and John E. Tilton, 2009. “Using the cumulative availability curves to assess the threat of mineral depletion: The case of lithium,” Resources Policy, Vol. 24, pp. 185-194
Concern Lithium batteries for hybrid and full electric automobiles Demand growth could exceed available resources Perhaps R&D should be redirected
Approach Literature review and interviews to identify known resources and their production costs No attempt to estimate undiscovered resources. So new discoveries can cause CAC to shift downward Demand scenarios
Types of Lithium Resources Brines Hard rock mineral deposits Clays Seawater
Lithium from Seawater Huge resource - 44.8 billion tons at 20% recovery rate Cost estimates based on 1975 study by Steinberg and Dang at Brookhaven National Lab updated for inflation – $7-10 per pound of lithium carbonate
Findings Depletion will not be a problem Conventional sources sufficient for the rest of this century and beyond Lithium from seawater is a huge source of potential supply and only raises costs of lithium used in autos from $42 to $150
V. CONCLUSIONS AND IMPLICATIONS Threat of depletion depends on three sets of determinants Movement up and shifts in CAC unknown and unknowable Shape of CAC (though often unknown) is knowable Knowledge of the shape can provide useful insights concerning the future threat of depletion
RESOURCE DEPLETION AND THELONG-RUN AVAILABILITY OF MINERAL COMMODITIES John E. Tilton Colorado School of Mines and Pontificia Universidad Católica de Chile Email: jtilton@mines.edu Birkbeck, University of London October 17, 2012