Download
1 / 42
430 likes | 589 Vues
Climate Change: Models, Scenarios, Climate Impacts. Models overview Accuracy – Uncertainty Scenarios Impacts. How would you model climate?. What components would you include? What about human factors? Limitations? How do test if you’re right?. Climate Models.

E N D
Models overview • Accuracy – Uncertainty • Scenarios • Impacts
How would you model climate? • What components would you include? • What about human factors? • Limitations? • How do test if you’re right?
Climate Models • Computer-run simulations of the atmosphere and ocean are the principal tool for predicting the response of the climate to increases in greenhouse gases. • The most sophisticated of these, called general circulation models, or GCMs, express in mathematical form what is known of the processes that dictate the behavior of the atmosphere, the ocean and land. • GCMs include the interaction of the atmosphere with the oceans and with the surface of the Earth, including plants and other ground cover. • Five components need to be considered – atmosphere, ocean, geosphere,cryosphere, and biosphere • Critical issues ofresolution – vertically, horizontally, and temporally. • The limitations of our knowledge and computing resources mean that the results of climate models are always subject to someuncertainty.
Components of the climate system • The atmosphere: circulation, terrestrial radiation, solar radiation, and the processes which go on in it, such as the formation of clouds and the atmospheric chemical reactions that determine the concentrations of some of its important constituents, such as methane and ozone. • The ocean: There is a constant exchange of heat, momentum, and water between ocean and the atmosphere. The ocean acts as a heat sink to delay climate change. In addition, ocean currents transport large amounts of heat and water around the world.
Components of the climate system • Theland surface: including its vegetation and seasonal snow cover, has an important influence on the flow of air over it, the absorption of solar energy, and the water cycle. • The cryosphere: those parts of the world whose surface is affected by ice, principally sea-ice in the Arctic and Southern Oceans and the land-based ice-sheets of Greenland and Antarctica. • Thebiosphere:terrestrial biosphere and marine biospheres play a major role in the carbon cycle and hence in determining the atmospheric concentration of carbon dioxide.
Atmosphere general circulation model (AGCMs) • Consist of a three-dimensional representation of the atmospherecoupled to the land surface and cryosphere. • Similar to a model used for numerical weather prediction (weather forecasting), but because it has to produce projections for decades or centuries rather than days it uses a coarser level of detail. • Useful for studying atmospheric processes, the variability of climate and its response to changes in sea-surface temperature. • Has to be provided with data for sea-surface temperatures and sea-ice coverage. Hence an AGCM by itself cannot be used for climate prediction, because it cannot indicate how conditions over the ocean will change. • AGCMs coupled to a 'slab' ocean • This type of model predicts changes in sea-surface temperatures and sea ice by treating the ocean as though it were a layer of water of constant depth (typically 50 meters) heat transport within the ocean being specified and remaining constant while climate changes. • This kind of model is useful for simulating what the climate would be like for some fixed level of carbon dioxide, but it cannot be used for predicting the rate of change of climate because this is largely determined by processes in the ocean interior.
Ocean general circulation models (OGCMs) An OGCM is the ocean counterpart of an AGCM It is a three-dimensional representation of the ocean and sea ice. OGCMs are useful by themselves for studying ocean circulation, interior processes and variability, but they depend on being supplied with data about surface air temperature and other atmospheric properties. Carbon cycle models The terrestrial carbon cycle is modeled within the land surface scheme of the AGCM, and the marine carbon cycle within the OGCM. T Needed in order to capture several important climate feedbacks on carbon dioxide concentration, for instance fertilization of plant growth by carbon dioxide and uptake or outgassing of carbon dioxide by the oceans. Atmospheric chemistry models The Hadley Centre has developed a three-dimensional global atmospheric chemistry model called STOCHEM. The chemical scheme is designed to include the main agents responsible for the production and destruction of ozone and methane in the lower atmosphere.
Met Office Hadley Center Model • Coupled atmosphere-ocean GCMs (AOGCMs) • These are the most complexmodels in use • Consisting of an AGCM coupled to an OGCM. • Global climate models typically have a resolution of a few hundred kilometers. • Some recent models include the biosphere, carbon cycle and atmospheric chemistry as well. • AOGCMs can be used for the prediction and rate of change of future climate. • They are also used to study the variability and physical processes of the coupled climate system.
Goddard Institute for Space Studies (GISS) • This version is a complete rewrite of previous models incorporating numerous improvements in basic physics, stratospheric circulation, and forcing fields. • Note – the goal has been to improve the mechanisms (i.e. physics), but with some compromise, specifically to resolution. • Horizontal resolution: • 4 x 5 or • 2 x 2.5 • Vertical resolution: • 20 layers (to 0.1hPa/60km) or • 23 layers (to 0.002hPa/80+km)
GISS observed • Dust Bowl – coupled relationship between La Nina SST changes, evaporation, land use practices, and atmospheric dust • A series of climate model simulations studied how dust storms altered precipitation during the Dust Bowl drought of the 1930s • Human land degradation was an integral part of the Dust Bowl story Observed precipitation anomaly (top panel), the model generated precipitation anomaly with SST forcing only (middle panel), and the model generated precipitation anomaly with the effects of observed SSTs and the added dust source (bottom panel). Model w/SST only Observed w/SST and dust via land use A dust storm strikes Powers County, Colorado, in April 1935
Increase in Modeling Capacity • Higher resolution: between the 1970s and the present day 256 times more computer power • Representations of all the key processes included in various versions of the model • Much longer predictions are run, typically reproducing the last 150 years and predicting the next 100 to 1,000 years • Far more experiments are run with different versions of the models so that we can quantify the uncertainty in our predictions
Model Accuracy • One important test of a climate model is to simulate a stable "current climate" for thousands of years in the absence of forcings. • Models can now produce climates with tiny changes in surface temperature per century but with year-on-year, seasonal and regional changes that mimic those observed. • These include jet streams, trade winds, depressions and anticyclones that would be difficult for even the most experienced forecaster to distinguish from real weather, and even major year-on-year variations like the El Niño–Southern Oscillation. • Another crucial test for climate models is that they are able to reproduce observed climate change in the past (hindcasting) • For example by showing that climate models successfully simulate the spatial pattern of 20th-century climate change only if they include anthropogenic effects (next slide). • Climate models can also be tested against very different climatic conditions further in the past, • Such as the last ice age about 9000 years ago and the Holocene warm period that followed it. As no instrumental data are available from this time, the models are tested against "proxy" indicators of temperature change, such as tree rings or ice cores.
A climate model can be used to simulate the temperature changes that occur both from natural and anthropogenic causes. The simulations represented by the band in: • only natural forcings: solar variation and volcanic activity. • anthropogenic forcings: greenhouse gases and an estimate of sulfate aerosols • (c) both natural and anthropogenic forcings included. From (b), it can be seen that inclusion of anthropogenic forcings provides a plausible explanation for a substantial part of the observed temperature changes over the past century, but the best match with observations is obtained in (c) when both natural and anthropogenic factors are included. These results show that the forcings included are sufficient to explain the observed changes, but do not exclude the possibility that other forcings may also have contributed. The bands of model results presented here are for four runs from the same model. Similar results to those in (b) are obtained with other models with anthropogenic forcing.
The climate models, far from being melodramatic, may be conservative in the predictions they produce. For example, here’s a graph of sea level rise: Here, the models have understated the problem. In reality the events are all within the upper range of the model’s predictions.
Uncertainty • Aerosols • Water Vapor • Clouds • Regional variability • Chaotic weather • Feedbacks & Forcings • Data availability and quality • See later slide • Perhaps the more we learn, the less we know
Uncertainty Inability after some 30 years of research to understand the likely climate response in the tropics and in polar regions is a major reason for uncertainty in climate change consequences. For the same scenario of future greenhouse gas increases, climate models differ by a factor of two in terms of their predicted warming in both regions. This has obvious implications for our ability to predict events in the tropics, such as hurricanes and drought, and at high latitudes, such as sea ice and ice sheet melting (with sea level rise). The Geophysical Fluid Dynamics Laboratory (GFDL) model tended to produce half the tropical warming reported in the Goddard Institute for Space Studies (GISS) model as a result CO2 input differences; On the other hand, its high latitude sensitivity was about doubled
Nakicenovic et al. 2000 SRES A schematic representation of the SRES scenario family. The A1 and A2 families have a more economicfocus than B1 and B2, which are more environmental, whilst the focus of A1 and B1 is more global compared to the more regional A2 and B2. • The quantitative inputs for each scenario are, for example, regionalized measures of population, economic development and energy efficiency, the availability of various forms of energy, agricultural production and local pollution controls. • Explicit policies to limit greenhouse gas emissions or to adapt to the expected global climate change are NOT included.
A1FI, A1T and A1B Scenarios • The A1 storyline and scenario family describes a future world of very rapid economic growth, global population that peaks in mid-century and declines thereafter, and the rapid introduction of new and more efficient technologies. • Major underlying themes are convergence among regions, capacity-building, and increased cultural and social interactions, with a substantial reduction in regional differences in per capita income. • The A1 scenario family develops into three groups that describe alternative directions of technological change in the energy system, distinguished by their technological emphasis: • A1FI = fossil fuel intensive • A1T = non-fossil energy sources • A1B = a balance across all sources; • where balanced is defined as not relying too heavily on one particular energy source and the assumption that similar improvement rates apply to all energy supply and end use technologies.
A2 The A2 storyline and scenario family describes a very heterogeneous world. The underlying theme is self-reliance and preservation of local identities. Fertility patterns across regions converge very slowly, which results in continuously increasing population. Economic development is primarily regionally oriented and per capita economic growth and technological change more fragmented and slower than other storylines. • B1 The B1 scenarios describe a convergent world with the same global population that peaks in mid-century and declines thereafter, as in the A1 storyline, but with rapid change in economic structures toward a service and information economy, with reductions in material intensity and the introduction of clean and resource-efficient technologies. The emphasis is on global solutions to economic, social and environmental sustainability, including improved equity, but without additional climate initiatives. • B2 The B2 storyline and scenario family describes a world in which the emphasis is on local solutions to economic, social and environmental sustainability. It is a world with continuously increasing global population, at a rate lower than A2, intermediate levels of economic development, and less rapid and more diverse technological change than in the B1 and A1 storylines. While the scenario is also oriented towards environmental protection and social equity, it focuses on local and regional levels.
The range of projections (Table SPM.1) is broadly consistent with the TAR, but uncertainties and upper ranges for temperature are larger mainly because the broader range of available models suggests stronger climate-carbon cycle feedbacks. • Warming reduces terrestrial and ocean uptake of atmospheric CO2, increasing the fraction of anthropogenic emissions remaining in the atmosphere. The strength of this feedback effect varies markedly among models. Source: 4th Assessment WG2 SPM
IS92 Emissions Scenarios • In the 1992 Supplement (IPCC, 1992) to the IPCC First Assessment Report (IPCC, 1990), Leggett et al. (1992) proposed six emissions scenarios, the IS92 scenarios, which reflected the large uncertainty associated with, for example, the evolution of population and economic growth, technological advances, technology transfer and responses to environmental, economic or institutional constraints. • The global-mean temperature change associated with the six IS92 scenarios • Wide divergence in the outer-years .
IS92a:a middle of the range scenario • In which population rises to 11.3 billion by 2100, economic growth averages 2.3% year between 1990 and 2100 and a mix of conventional and renewable energy sources are used. • Only those emissions controls internationally agreed upon and national policies enacted into law, e.g., London Amendments to the Montreal Protocol, are included. Likely Scenario?
Land areas are projected to warm more than the oceans with the greatest warming at high latitudes Annual mean temperature change, 2071 to 2100 relative to 1990: Global Average in 2085 = 3.1oC
Some areas are projected to become wetter, others drier with an overall increase projected Annual mean precipitation change: 2071 to 2100 Relative to 1990
Snow – Ice – Frozen ground • Changes to Arctic and Antarctic ecosystems • Increased/enlarged glacial lakes • Unstable ground in permafrost regions; rock avalanches in mountain regions Example: • Siberian lakes disappearing as the permafrost thaws and lake water drains deeper into the ground
Snow – Ice – Frozen ground >> Hydrologic Example: • Grinnell Glacier, Glacier National Park, MT
Hydrologic • Increased runoff and earlier spring discharge in glacier- and snow-fed rivers • Warming of lakes and rivers. Effects on thermal structure and water quality. Example: • Rainier National Park, WA
Terrestrial Biological systems • Earlier timing of spring events • Migration • Leaf flushing (greening of vegetation) • Egg-laying • Poleward and upward shift in plant and animal ranges • Increased competition and conflict • Or…interbreeding >
Marine Biological systems • Increases in algal and zooplankton abundance in high-latitude and altitude lakes • Shifts in ranges: Cold-adapted to Warm-adapted • Shifts in ranges and abundance of algal, plankton and fish in high latitude oceans This massive “red tide” of the dinoflagellate Noctiluca stretched for more than 20 miles along the southern California coast. Non-toxic blooms such as these can cause extensive mortalities of plants and animals in shallow waters when the bloom biomass decays, stripping oxygen from the water. (Photo by P. Franks)
Coastal systems • Increased occurrence of storms, flooding, inundation • Coastal erosion • Coral bleaching • Coastal wetlands negatively effected by sea-level rise Maldives is made up of a chain of 1190 small coral islands that are grouped into 26 atolls (80 islands resorts and 200 inhabited islands)
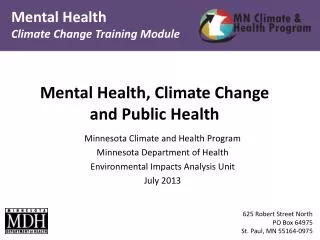
Health France heat wave death toll set at 14,802 • Malnutrition • Deaths as a result of: • Heatwaves • Fires • Drought • Floods • Increased respiratory ailments with greater surface level • Changing distribution of infectious disease Maximal temperature in the Paris area, excess emergency department visits (grey bars), and hospital admissions (white bars) in the Assistance Publique–Hôpitaux de Paris, 1–30 August 2003.
Other Impacts • Ecosystems • Source or sink? • Plant / animal extinction • CO2 >> acidification of oceans • Pests / infestation >> fires • Food production: crop productivity up or down? • High latitudes versus Mid-Low latitudes • Depends on temperature increase – beyond 1-3C all regions a show decrease
Thursday’s Readings: The Real Holes in Climate Science The Climate Machine