Download
1 / 11
110 likes | 232 Vues
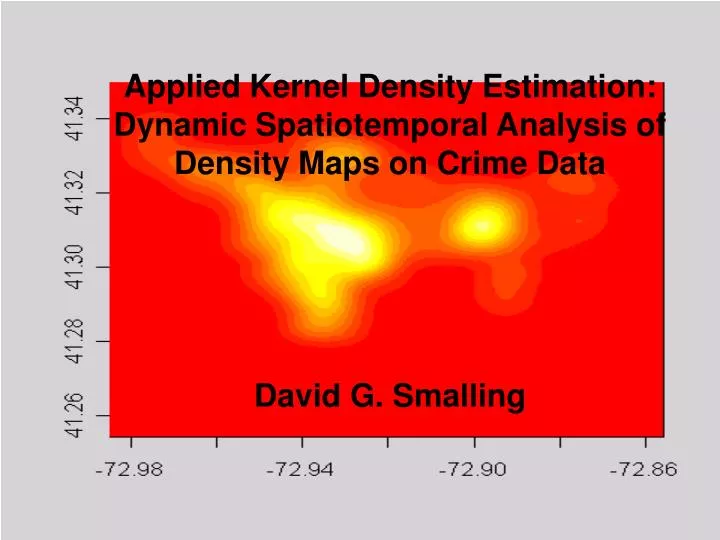
Applied Kernel Density Estimation: Dynamic Spatiotemporal Analysis of Density Maps on Crime Data. David G. Smalling. My Project Entails.

E N D
Applied Kernel Density Estimation: Dynamic Spatiotemporal Analysis of Density Maps on Crime Data David G. Smalling
My Project Entails • A detailed study of crime movement in New Haven, Connecticut and Kingston, Jamaica, in which I will analyze the effects of sociological trends such as political upheavals and placement of landmarks (police stations), and etc. • The development of a system which utilizes latitude and longitude data to generate and image sequence of density maps which will ultimately be used to construct a video of the study region. • Detailed study of the interactions between topographical changes and cluster movement. • An attempt to quantify Spatiotemporal Correlation between multiple clusters. • Development of algorithmic heuristics relative to the dataset in order to reduce the computational complexity of density map generation.
Previous Work • Prof. Parris Lyew Ayee of the University of the West Indies in Kingston Jamaica has provided me with a dataset containing very detailed accounts of violent (non-fatal) crimes in Kingston, Jamaica for the year 2004. • Professor Ayee is himself an expert in spatial modeling and analysis. After having completed groundbreaking research and University of Oxford in Geographic Information Systems, he has supervised numerous studies for the Jamaica Constabulary Force and has significantly optimized the positioning of police efforts in Jamaica.
Other uses of KDE • Recent work done by the University of Ljubljana demonstrated methods by which physical laws may be extracted from experimental data with unprecedented accuracy. • Kernel Density Estimation is also often used by crime prevention agencies such as the Federal Bureau of Investigation (FBI) to analyze subtle trends in criminal movement and to predict the movement of repeat offenders. • The U.S. Department of Education has utilizes a software package under a program called Project Strike Back student financial aid records for the FBI.
Design • Definition Frame A frame of size f is a density map derived from a collection of latitude-longitude data from f different rows.
Design • The traversal of the aforementioned frame through the dataset is at the underpinning of this method of analysis. • For a specified collection of data points in a Euclidean environment such as latitude-longitude data, we take data from the mth row to the (m+f-1)th row and derive a density map corresponding to f elements inclusive. • The construction of the necessary image sequence involves continuing this process, taking data from (m+1)th row to the (m+f)th row up to the frame spanning (D-f+1)th row to the Dth row. • This technique is depicted graphically below. Where D = dimrow(dataset).
Calibration • In order to accurately pin the generated density maps to the locations, a plot is exported that contains the bounds of our study region and some sample points. • These points are then loaded into a map system with verified accuracy (eg: Google Earth). • Using these images, accurate scaling of the density plot to the map of the study region may be achieved.
Notes • This method of analysis proves useful in the study of non-organized crime environments and observation of aggregate movement of petty crimes that are unplanned and usually quasi-random in nature. • Due to the computational complexity of the algorithms described above it was difficult to run comprehensive tests on the datasets.