Download

1 / 13
160 likes | 379 Vues
Marine Case Analysis Strategic Marketing Workshop. Business Case Analysis - Fundamentals. Gather all information at the time of the case Here, 2005 Case write-up in the pre-reading Presentations in session Get to know the “Kahuna” Follow sessions in order and build a case day-by-day

E N D
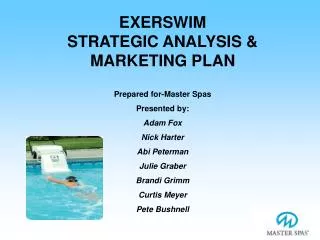
Marine Case Analysis Strategic Marketing Workshop
Business Case Analysis - Fundamentals • Gather all information at the time of the case • Here, 2005 • Case write-up in the pre-reading • Presentations in session • Get to know the “Kahuna” • Follow sessions in order and build a case day-by-day • We will go over a “post mortem” and lessons learned via case Epilogue • Presentation and report-outs on Friday
The Captain Jeppesen Story Strategic Marketing Workshop
TBD Marine market segments15:1 (15 marine vessels to every 1 aircraft) 14K Ships 44K mid-size 32K workboats 112K tows and 440 K barges 5 million Aviation *Based on estimated number of vehicles needing navigation.
Business Case Inputs: Market Segment Assumptions Pricing Assumptions
2010 LRBP (2005-2009) BROWN WATER 4.1% or 4,705 boats BLUE WATER 4.5% or 4,157 boats CORENET + APPS 1% or 1,102 boats Market capture (penetration) curve(Vector navigation data and software sales only) 2004 2005 2007 2009 2010 2012
2010 LRBP (2005-2009) We believe, the market capture curve has just begun! Market opportunity!Potentially a $2 billion business. 100% 80% 60% 40% 20% 0 2004 2005 2007 2009 2010 2012
Data Development zone investments: 2004-2006 development timeframe Applications Start-up Total = $40
Acquisitions may improveour base case – will they? In every area we are considering, there are existing [smaller] players. The market is highly fragmented.
Increase Revenue Shorten Time to Market 2 1 Decrease Development Costs 3 Enable Solid Future Growth 4 Acquisition improvement strategy(Improving the ‘build from dirt’ model)
Big Stuff Data Applications V/S Vendor/Supplier $ Acquisition Target Strategic Partner Competitor Customer Major thrust areas vs current players V/S ? $ ? ? ? ? $ ? …others …others …others