Download
1 / 8
170 likes | 1.31k Vues
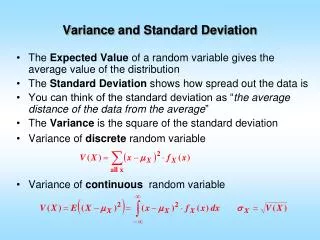
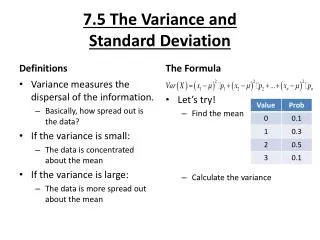
S1 Measures of Dispersion The mean, variance and standard deviation. S1 Measures of Dispersion. Objectives: To be able to find the variance and standard deviation for discrete and continuous data using excel. σ ² = 218 – 36 ² = 4.69 7 7. _. Variance = Σx ² – Σx ²

E N D
S1 Measures of DispersionThe mean, variance and standard deviation
S1 Measures of Dispersion Objectives: To be able to find the variance and standard deviation for discrete and continuous data using excel
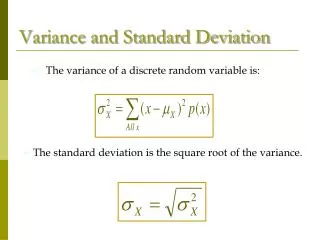
σ² = 218 – 36² = 4.69 7 7 _ Variance = Σx² – Σx ² n n The marks scored in a test by seven students are 3,4,6,2,8,8,5. Calculate the variance and standard deviation. x² 9 16 36 4 64 64 25 σ = √4.69 = 2.17 Σx = 36 Σx² = 218
_ Variance = Σx² – Σx ² n n Variance and standard deviation of discrete data Use excel to quickly work out the variance and standard deviation of the questions below • 3, 9, 12, 24, 10, 21, 27, 16 • 45, 56, 61, 34, 50, 50, 66, 51, 48, 49, 38 • 18, 22, 30, 27, 19, 25, 2, 156 Compare the answers you got in Q1 and 2 to the answer for Q3. Explain the difference
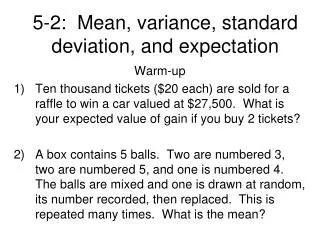
Variance = Σfx² – Σfx ² Σf Σf Variance = 154050 – 4096 ² 109 109 The variance and standard deviation from a frequency table fx fx² 3675 22032 39701 49096 39546 105 612 1073 1292 1014 Σfx=4096 Σfx²=154050 Σf=109 σ= 1.109 σ²=1.19805
Variance = Σfx² – Σfx ² Σf Σf Use Excel to quickly work out the variance and standard deviation of the question below Change the frequency for x=4 or x=8. What happens to the standard deviation? What happens when you change the frequency when x=6? Explain why
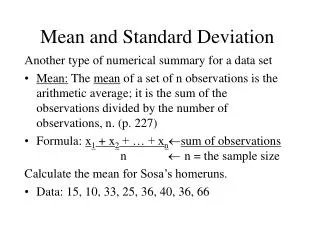
σ² = 6487.5 – 285 ² = 128.85802 27 27 Variance and standard deviation from a grouped frequency distribution σ = √128.85802 σ = 11.35
Use excel to work out the standard deviation for the following sets of data Comment on and compare the standard deviation for each of the data sets Describe the skewness of each of the data sets